Indicators of Climate Change
What is climate change?

In the last couple of decades, average temperatures have risen around the world. This change is impacting local weather and climate. But what are weather and climate?
Weather vs. Climate
Weather is the day to day change in temperature and precipitation in a place.

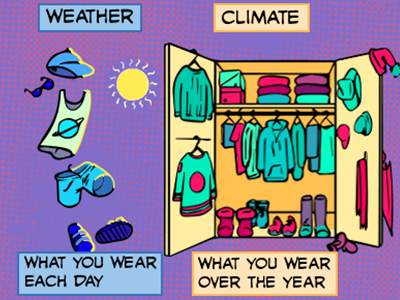
Climate is the usual weather in a place over many years.
Weather can change rapidly. You can check the weather by looking outside or at your phone. The climate changes much more slowly. We need many years of data to understand how the climate is changing.

Scientists study climate change by putting snapshots of weather together. For example, imagine that you wanted to know how your height changed over the years. You could look at pictures of all your first days of school.
Each individual picture doesn’t tell us much. But, when we put them together we can see a pattern of how height has changed over time. This pattern over time is called a trend.

Questions
What trend do you see when you look at these first day of school pictures?
Looking at the weather on a specific day is like looking at one picture at a time. It doesn’t tell us much about how the climate is changing. Scientists need to study trends over time to understand how the climate is changing.
Watch this video to learn more about climate trends (Viewing Time 2:09 min.).
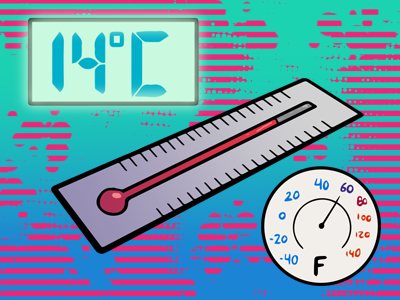
Temperature: One Indicator of Climate Change

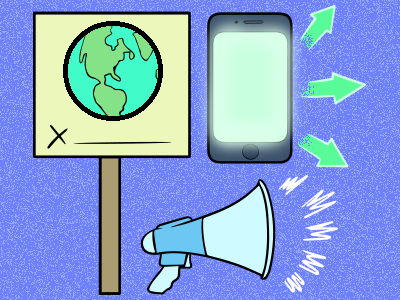
Data about trends in weather are indicators of climate change. Indicators tell us the state of something. A smartphone's battery display indicates how much charge your phone has left.
Temperature data is one indicator of climate change.
Scientists collect temperature data from all around the world. They compare current and past data to understand how the climate is changing. Here are some of the ways that scientists collect this information.
Scientists began using modern thermometers to measure and record temperature about a century ago. Today, data comes from thermometers at thousands of weather stations around the world.
Image ©2021 Let’s Talk Science
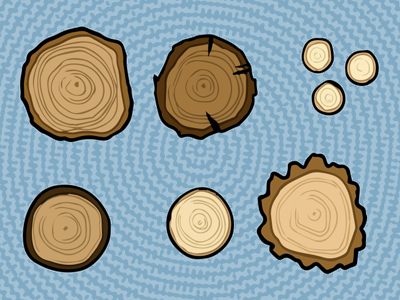
Scientists use other sources for temperature data from before thermometers were in use. Measuring the rings found in a tree core is one way they can study past temperature trends.
Image ©2021 Let’s Talk Science
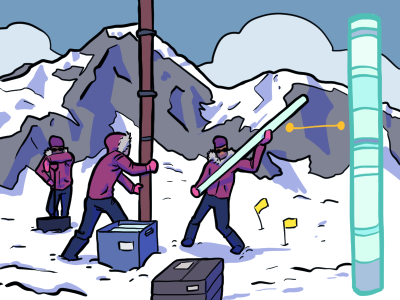
Ice cores are long pieces of ice taken from deep holes drilled into glaciers and ice sheets. Scientists measure the layers formed every winter in ice cores. They use this information to reconstruct temperature data going back 800,000 years.
Image ©2021 Let’s Talk Science
Questions
This map compares average temperatures in 2020 with 1951-1980 averages. What do you notice? What do you wonder about?
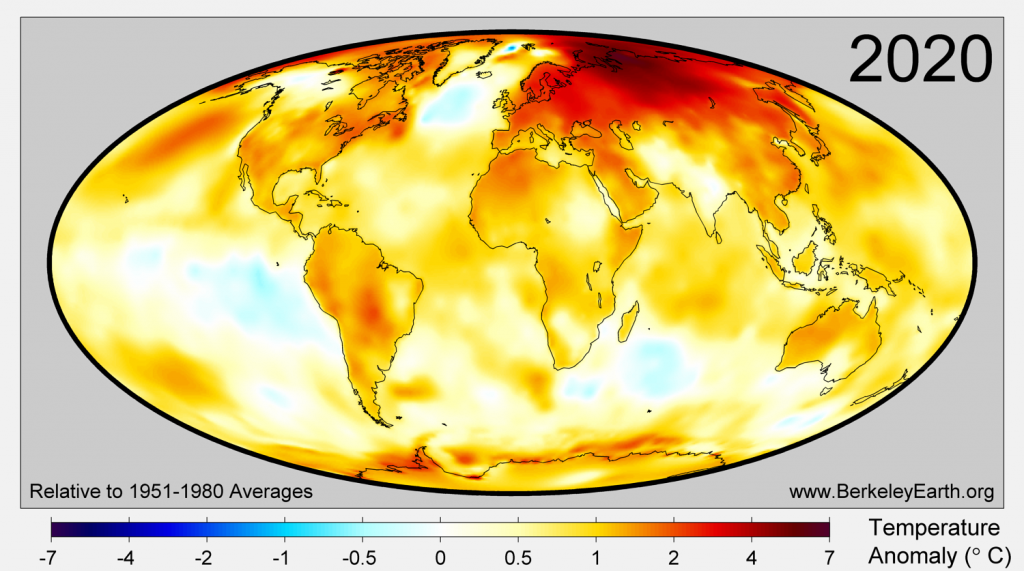
This map shows how local temperatures in 2020 have increased relative to the average temperature in 1951-1980 (Source: Berkeley Earth).
You probably noticed that the Earth is getting warmer. The average temperature on Earth’s surface has increased by about 1 degree Celsius in the past 100 years.
Greenhouse gas emissions from human activities are responsible for this warming.
Other Indicators of Climate Change
Rising global temperatures are one indicator of climate change. Explore some other indicators of climate change in the slideshow below.

Temperatures in the polar regions are rising more quickly than other places. Because of this, sea ice in the Arctic is melting. Look at this map. How has the median area covered by sea ice changed in recent years?
Melting Sea Ice
Temperatures in the polar regions are rising more quickly than other places. Because of this, sea ice in the Arctic is melting. Look at this map. How has the median area covered by sea ice changed in recent years?

Rising temperatures lead to melting ice. Melting ice leads to changes in sea level. What does this graph tell you about how global sea levels have changed in the past 30 years?
Rising Sea Levels
Rising temperatures lead to melting ice. Melting ice leads to changes in sea level. What does this graph tell you about how global sea levels have changed in the past 30 years?

Climate change impacts ecosystems and communities differently. People’s lived experiences over many years can also give us information about how the climate is changing. Watch the below video to learn more.
Changing Ecosystems
Climate change impacts ecosystems and communities differently. People’s lived experiences over many years can also give us information about how the climate is changing. Watch the below video to learn more.
Listen to elders from Indigenous communities talk about what they see around them (2016, 4:18 min).
Questions
What does this video tell you about how climate change is impacting communities and ecosystems in Northern Ontario?
We are already feeling the impacts of climate change. More than one-fifth of people live in places where the average temperature has increased by more than 1.5 degrees Celsius.
However, reducing the amount of warming by a small amount can have a big impact. Every fraction of a degree of warming matters. Take a look at the impacts of 1.5 vs 2 degrees of global warming.
We can take action now to limit warming to 1.5 degrees Celsius. Visit the Actions page for some ideas about how you could take action to reduce clothing-related greenhouse gas emissions.
Let us know what you think...
Learn More
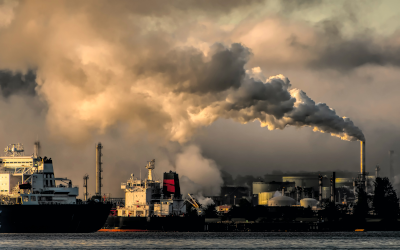
Pollutants going into the atmosphere (Chris LeBoutillier, Unsplash)
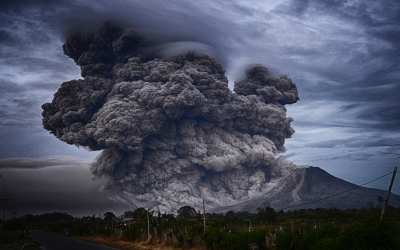
A volcano erupting (Yosh Ginsu, Unsplash)
NASA's Earth minute: Usual suspects
Video (1:30), 2014
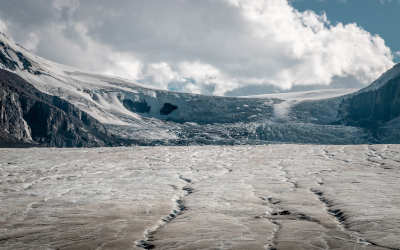
Columbia Glacier (Louis Paulin, Unsplash)
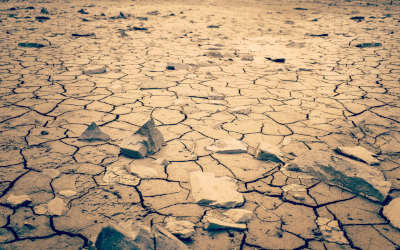
Arid ground (Joshua Woroniecki, Unsplash)
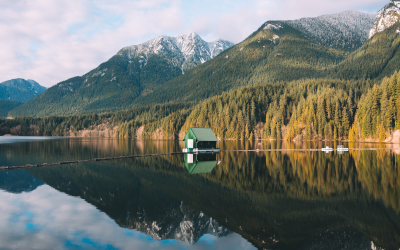
Cleveland Dam in northern B.C. (Kelen Loewen, Unsplash)
Climate change in Canada's north
Video (8:20), 2015
References
IPCC. (2021). Climate change widespread, rapid, and intensifying.
NASA. (n.d.). How do we know the climate is changing?
NOAA. (2020). What’s the difference between weather and climate?
NSF- Ice Core Facility. (n.d.). About Ice Cores
WWF. (n.d.). Our planet is warming. Here’s what’s at stake if we don’t act now.
Reference List
IPCC. (2021). Climate change widespread, rapid, and intensifying.
NASA. (n.d.). How do we know the climate is changing?
NOAA. (2020). What’s the difference between weather and climate?
NSF- Ice Core Facility. (n.d.). About Ice Cores
WWF. (n.d.). Our planet is warming. Here’s what’s at stake if we don’t act now.