
Overview
General Description
Students will download, graph and analyze data for one or more environmental conditions in their classroom. Students will develop and implement an action plan for improving classroom conditions based on their data analysis.
Suggested Timing
50 - 100 min. plus time to implement action plan
Success Criteria
Students will:
- Create accurate and neat graphs with appropriate titles, labels, scale, legends, dependent and independent variables on correct axes
- Develop and implement an Action Plan using SMART goals (specific, measurable, achievable, realistic, timely)
- Correctly follow a data collection protocol
- Use tools and equipment appropriately
- Collect and upload accurate and complete data
Student Prior Knowledge and Skills
- Completed Classroom Inquiry
- Confident use of measuring tool(s) to collect accurate readings of environmental conditions
- Familiarity creating line graphs
Preparation
- If students are not using the online resources, BLMs and Backgrounders will need to be printed.
- If students are using online resources, sign out computer lab/laptops/chromebooks/iPads/etc. (ideally one device per 2–3 students).
- Print enough copies of BLM 2.2: Action Plan Template for groups of 3–4 students.
- You may wish to have students keep a journal during the implementation of the Action Plan to record observations, impressions, challenges and successes.
Implementation Options
- Graphing could be done on paper or using an online graphing tool of your choice (see Additional Resources below).
- Consider allowing students to develop a pitch to present to the principal about how the environmental conditions of the classroom and/or school could be improved.
- Students will need time, and potentially resources (equipment, access to the school custodian or principal, etc.) to implement the Class Action Plan. Some of this could be done during class time, but other tasks may need to be done outside of class time.
Materials
- BLM 1.3: Data Collection Form
- BLM 2.1: Graph Template (or graph paper)—enough for 3 graphs per student
- BLM 2.2: Action Plan Template - 1 per group of 3–4 students
- Environmental Conditions on Earth and on the International Space Station Backgrounders:
- Temperature on Earth and on the Space Station (Grade 6)
- Temperature on Earth and on the ISS (Grade 9–12)
- Relative Humidity on Earth and on the Space Station (Grade 6)
- Relative Humidity on Earth and on the ISS (Grade 9–12)
- Carbon Dioxide on Earth and on the ISS
- Light on Earth and on the ISS
- Noise on Earth and on the ISS
- Environmental measurement tool(s)
- Devices with internet access—minimum 1 per class
- Digital tool for creating graphs (e.g., MS Excel, Google Sheets, GeoGebra for Google Classroom, etc.)
Optional
1. Data Download
Students will download the data they collected on the environmental conditions in their classroom and on board the ISS as an Excel (.xlsx) file*.
*Please note: We do not currently support the download of personal datasets. However, you can download the national dataset. To do so, click on “Inquire” and then “Data Submission” or click the button below.
2. Data Analysis
Teachers need to determine if their students will analyze only their own group dataset, the National Project dataset, or both. Review the Data Analysis Activities guide for detailed activities using Google Sheets to analyze Living Space project data. The downloaded dataset can be opened in Microsoft Excel, Google Sheets, or any other program that can open Excel (.xlsx) files.
Look at the Group or Project dataset and ask the following guiding questions:
- Data was recorded about indoor environments. What is data?
- Is this data discrete (something that can be counted) or continuous (measured using tools)?
- Is any of the data extreme (outside of reasonable expectations)?
- Does the data contain ranges in the values that look suspicious?
- If you find data that concerns you, how can you determine if the data is reliable and accurate? What human factors might have impacted the data reliability? What technical factors might have impacted the data reliability and accuracy?
- What type of graph would best represent this type of data?
- When would we use a bar graph? Line graph? Pie chart?
Graphing
Students will create line graphs for each of the environmental condition(s) that the class measured.
- Students can create line graphs using regular graph paper, or BLM 2.1: Graph Template, or a computer program of your choice (e.g., Microsoft Excel, Google Sheets, or GeoGebra). (Review the Data Analysis Activities guide for detailed instruction on using Google Sheets to produce graphs for the Living Space project data).
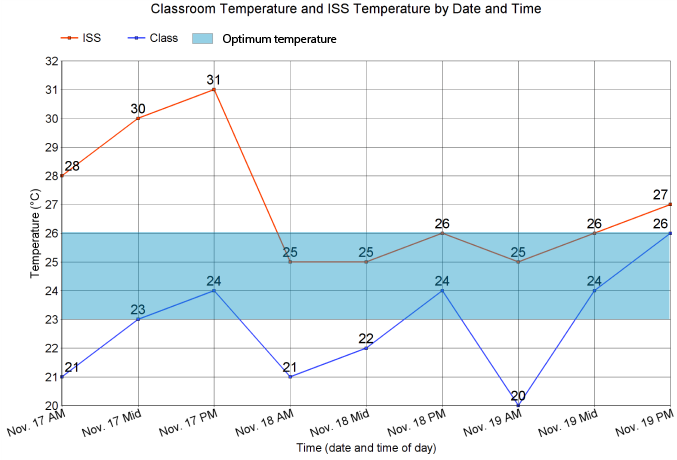
- For each environmental variable, students should graph both the data from their classroom and the data from the ISS on the same graph and identify the two sets of data using a legend (see exemplar below).
- Students should shade in the range of optimal conditions for classrooms on their graph(s). Recall that these optimal ranges can be found in the Environmental Conditions on Earth and on the International Space Station Backgrounders linked above.
- Student-created graphs can be assessed for completeness and use of proper graphing conventions.
Patterns and Trends
Ask students to read and describe the graphs. This can include having students describe patterns and trends in the data using guiding questions such as:
- Can you observe any patterns in the data? If so, how would you describe the patterns?
- Do you observe any upward or downward trends?
- Which was the hottest day?
- Which day had the highest carbon dioxide reading?
- Which day was the most humid?
With an elbow partner, have students interpret and draw conclusions about the data. Use guiding questions such as:
- What could explain the patterns and/or trends that you observe?
- Why might the temperature go up in our classroom during the day? Does this also happen on the ISS? Why or why not?
- What do you think might be causing the high and low points?
Differentiation Option
- To support older grades or advanced students, you may wish to have students calculate the mean, median, mode and range of each dataset.
- Consider exploring the following Backgrounder: Data Analysis Using Google Sheets
Compare to a Standard
It is important to consider indoor environmental variables in the context of recommended guidelines for indoor environments. Students can compare the environmental data they collected in the classroom with the optimum ranges in the chart they filled out on BLM 1.2 Understanding Indoor Environments during Classroom Inquiry, or by referencing the recommended guidelines below.
Use prompting questions such as:
- How does our classroom temperature, relative humidity, and/or carbon dioxide level compare to recommended guidelines for indoor environments?
- Do you think the time of day influences whether each classroom environmental variable measures within an acceptable range?
- If any of our measurements fall outside of the acceptable range, what might be the contributing factors?
- Why do you think the recommended guidelines for temperature and relative humidity vary by season?
Temperaturei,iv
|
Summer Conditions |
Winter Conditions |
|---|---|
|
23–26°C (optimum 24.5 °C) |
20–23.5 °C (optimum 22 °C) |
Relative Humidityii,iv
|
Summer Conditions |
Winter Conditions (<-10 °C) |
|---|---|
|
30–50% |
30% |
Carbon Dioxidei,iii
| 350–450 PPM | Typical outdoor range |
|---|---|
|
800-1200 PPM |
Typical indoor range |
|
<1200 PPM |
Recommended indoor concentrations Note: In indoor settings, carbon dioxide generally should not be greater than 700 ppm above outdoor carbon dioxide levels; this typically corresponds to indoor concentrations below 1,200 ppm. |
|
>5000 PPM |
Exceeds recommended short-term exposure limit during an 8-hour workday. Note: This is not an acceptable constant level for indoor spaces. Some hazardous professions like astronauts and welders may tolerate these upper limits but will take counteracting measures. |
Note: even if environmental measurements fall within the above recommended ranges for temperature, relative humidity and carbon dioxide, the comfort of an indoor environment may also be influenced by other factors such as a person’s activity level, clothing, airspeed, or sunlight.iv
References:
- iGuidelines on ventilation, thermal comfort and indoor air quality in schools (UK Department of Education, 2016)
- iiMeasuring Humidity in Your Home (Canada Mortgage and Housing Corporation, 2009)
- iiiOccupational Exposure Limits (The National Institute for Occupational Safety and Health, 2018)
- ivThermal Comfort for Office Work (Canadian Centre for Occupational Health and Safety, 2023)
3. Create Action Plan
Students will brainstorm different ways to assess and improve the environmental condition(s) the class measured, for example:
- Increase temperature
- Decrease temperature
- Increase humidity
- Decrease humidity
- Decrease carbon dioxide
Based on the level of students’ prior knowledge, you may need to ask some guiding questions, such as:
- What is a thermostat? What does it do?
- Who controls the temperature in our room?
- Can our windows open to let in fresh air?
- What sort of devices do you know of that can increase or decrease the humidity in a room?
- How do plants and animals produce and use the carbon dioxide in the environment?
As a class, discuss the feasibility of the various solutions. Some may be very easy (e.g., opening a window) whereas others may be more difficult (e.g., adjusting the temperature if there is not a thermostat for the room).
For further information on how to improve indoor air quality:
- Improve indoor air quality (Government of Canada, 2022)
- Infographic: Maintain and improve indoor air quality (Health Canada, 2015)
Action Plan Template
- Based on the first period of data collection (baseline data) and the class’s brainstorming, decide as a class which environmental factor to change: either temperature OR humidity OR carbon dioxide.
- Use the recommended guidelines above to help you determine a reasonable and realistic target (e.g., lower the carbon dioxide level to <1200 PPM).
- Working in small groups (3–4), students can use the following Action Plan template:
- BLM 2.2: Action Plan Template- 1 per group of 3–4 students
- Discuss the steps of setting up an Action Plan with the students. See the sample below:
| Goals | Actions | Resources | Potential Roadblocks | Responsibilities |
|---|---|---|---|---|
|
Encourage the students to make the goals SMART goals (specific, measurable, achievable, realistic, timely) This could include an increase in the relative humidity if too dry, a decrease in the carbon dioxide if the levels are higher than the safe range, an increase in the temperature if too cold, etc. |
Have students identify the activities that they want to try to meet their goal. This could include using a humidifier or space heaters, asking for the ventilation system to be checked, etc. |
Have students think about what they will need in order to accomplish their goal. This can include physical things, such as humidifiers and weather stripping as well as human resource-related things such as assistance from parents to raise money or permission from the principal to adjust the thermostat in the room. |
Have students consider what might affect their plans. This can include such things as weather, not receiving permission from the principal, insufficient funds, safety rules, etc. |
Have students consider who (themselves included) will need to be involved in their plans. This may include the principal, teacher, parents, students, custodian, etc. |
|
e.g., to make our classroom feel less dry. |
e.g., get a humidifier for the classroom. |
e.g., Money to buy humidifier, permission from the principal to use it. |
e.g., not enough money to buy a humidifier. We could try to borrow one. |
e.g., principal, teacher, parents. |
- Provide time for each group to share their action plan.
- As a class, decide on a single class goal and determine the associated key actions, resources, and responsibilities. This will form the class’s Action Plan.
You may wish to review the Class Action Plan Exemplars below:
4. Implement Action Plan
- Based on the Class Action Plan, create a series of steps for what needs to be done (plan the work). You may wish to use an organizer such as a flow chart to help organize the steps.
- List and gather materials and/or equipment that you will need, choose who will do the tasks, and talk to any people that will need to give their permission.
- Implement the change outlined in the Class Action Plan.
- Collect and record data using selected environmental measurement tool(s) after the implementation of the Class Action Plan (i.e., after the change is made).
- Upload this new data to the Living Space dataset using the same protocol as the first data collection period.
Additional Resources
- Brainstorming (Learning Strategy)
- ChartGo (Accessed March 20, 2023)
ChartGo is an online chart creator that lets users create a variety of charts including bar charts, line charts, pie charts and area charts. Data can be imported from MS Excel or CSV. - Create a Graph (Accessed March 20, 2023)
Create a graph, from the National Centre for Education Statistics (USA), is a good tool for online graphing (note: Requires Macromedia Flash Player). - How Science Works: Language (Accessed March 20, 2023)
- This glossary, from AQA Science, includes definitions of many science inquiry terms such as precision, accuracy, sources of error, etc.
- Live Gap Charts (Accessed March 20, 2023)
This is a free chart & graph maker with live preview. Choose from different chart types (Line, Bar, Stacked bars, Radar, Polar Area, Pie and Doughnut). - Online Charts (Accessed March 20, 2023)
This is a powerful online charting and graphing tool. It is somewhat complex, but provides excellent visualization possibilities. - Setting SMART Goals (Accessed March 20, 2023)
This is another short YouTube video on setting SMART goals. - SMART Goals—Quick Overview (Accessed March 20, 2023)
This YouTube video helps students understand how and why to set SMART goals.