Overview
General Description
Students will be introduced to the Living Space project and complete personal surveys about the indoor conditions of their classroom. They will explore how various indoor environmental conditions affect physical and mental health on Earth and on the International Space Station (ISS). Using a custom COZIR sensor array students will collect, record and upload data on the environmental conditions in their classroom into a national dataset.
Suggested Timing
50–100min. plus time for coding and data collection
Success Criteria
Students will:
- Assess the indoor environmental conditions of their classroom
- Explore how various abiotic factors affect physical and mental health on Earth and on the ISS
- Use tools and equipment appropriately
- Successfully set up and code the class COZIR sensor array
- Correctly follow a data collection protocol
- Collect, record and upload accurate and complete data
Student Prior Knowledge and Skills
- Experience with the MakeCode block-based coding environment
- Familiarity with downloading and transferring files to a device via USB port
Preparation
- BLMs and Backgrounders may need to be printed.
- Sign out computer lab/laptops/chromebooks/etc. (ideally one device per 2–3 students).
- Familiarize yourself with the data collection requirements:
- Choose a three-day period in which data collection can occur at the same time each day.
- The class will need at least one device with internet access to upload data.
- Ensure that your COZIR sensor array is calibrated, programmed, and has been tested properly before taking readings.
Implementation Options
- You may wish to have students complete one of the Digital Literacy Activities prior to coding the COZIR sensor array. This will help students become familiar with the MakeCode environment and uploading .hex files to the micro:bit.
- If reliable internet access is an issue, you may wish to investigate options for using the MakeCode editor offline.
- Ideally, the class will measure, record and upload data on classroom environmental conditions at the same time of day, over a three-day period (see Data Collection for more information).
- Data can be collected and uploaded in real time into the Living Space dataset or recorded on BLM 1.3: Data Collection Form and uploaded later.
- Data upload and download can also be handled solely through the educator’s Let’s Talk Science account (see Data Upload for more information).
Materials
- BLM 1.1: Classroom Environment Survey - 1 per student
- BLM 1.2: Understanding Indoor Environments - 1 per student or small group
- BLM 1.2: Understanding Indoor Environments (ANSWERS)
- BLM 1.3: Data Collection Form*
- Backgrounder: Recommended Measurement Tools
- Environmental Conditions on Earth and on the International Space Station Backgrounders:
- Temperature on Earth and on the Space Station (Grade 6)
- Temperature on Earth and on the ISS (Grade 9–12)
- Relative Humidity on Earth and on the Space Station (Grade 6)
- Relative Humidity on Earth and on the ISS (Grade 9–12)
- Carbon Dioxide on Earth and on the ISS
- Light on Earth and on the ISS
- Noise on Earth and on the ISS
- Backgrounder: Setting up the COZIR Sensor Array
- Backgrounder: Coding the Sensor Array - Level 1
- Backgrounder: Coding the Sensor Array - Level 2
- micro:bit Safety Guide for Educators
- micro:bit Safety Guide for Students
- micro:bit (with USB cord) - at least 1
- COZIR sensor board - 1
- Alligator clips - 4
- 9V battery and barrel connector
- Computers – PCs, chromebooks, laptops**
- Access to the internet and MakeCode website (http://makecode.microbit.org/)
*Data can be entered directly into the Living Space dataset instead of on paper.
** The use of iPads, tablets or mobile devices for coding will require installation of the mobile app for micro:bit.
1. Introduction
Students will begin by assessing the environmental conditions in their classroom:
- Discuss/define “environment.”
- Brainstorm factors that could affect the environment inside the classroom.
- Ask students to think about the three most important factors.
- Encourage students to share and justify their ranking.
Use probing questions such as:
- How does each environmental factor affect you physically?
- How does each environmental factor affect you mentally?
- What do you think are the three most important environmental factors?
- Why do you think these factors are important?
Give students time to complete the following survey, emphasizing that there are no right or wrong answers. (You may wish to print enough copies for your students, or have them make a copy of this GoogleDoc to complete online).
As a class, review the Classroom Environment Survey completed by students:
- Were there similarities and/or differences among student responses?
- Why do you think people react differently to environmental factors?
- How do these abiotic (non-living) factors affect the “environment” of your classroom?
Consider completing the Google Form version of the Classroom Environment Survey to see how classes across Canada feel about their classroom environments!
2. Learning about Indoor Environments
After beginning to assess classroom conditions during the project introduction, students will investigate optimal environmental conditions for life on Earth and on the ISS. They will research and gather information on various indoor environmental conditions (variables), including their effect on mental and physical health, by answering the following questions:
- What is the unit of measurement for the variable?
- What tools can be used to measure the variable?
- How do people feel (mental and physical) if the variable is too high?
- How do people feel (mental and physical) if the variable is too low?
- What is the optimum range for the variable in a classroom?
- At what levels does the variable become dangerous to people? (i.e., too high or too low)
Students can use the following graphic organizer to guide their research:
- BLM 1.2: Understanding Indoor Environments - 1 per student or small group
Once students have completed their research, discuss responses as a class. For example, ask students to rank the importance of the environmental variables for health and well-being from 1 (most important) to 5 (least important). The Answer page below outlines appropriate responses:
3. Classroom Data Collection
Students will now set up and code the COZIR sensor array in order to collect and record data on the environmental conditions in their classroom. The Living Space project requires readings for:
- classroom temperature (°C)
- classroom relative humidity (%)
- classroom carbon dioxide (PPM)
COZIR Sensor Array
There are two parts to setting up the COZIR sensor array - the software (coding) set-up and the hardware (devices and wiring) set-up.
Software
Students may choose to code the COZIR sensor board on MakeCode using either Level 1 code or Level 2 code.
Time permitting, have all students write the code for the class sensor array in MakeCode. If time is not available, you could do it yourself or delegate the coding to a small group of students.
Level 1
Level 2
Hardware
Review and print the one-page backgrounder below to help guide the set-up of the COZIR sensor array:
The Let’s Talk Science custom COZIR sensor board attaches to a micro:bit using the alligator clips provided in the kit.
- Review the micro:bit safety instructions with students:
- Upload the Level 1 or 2 code to a micro:bit.
- Connect the COZIR sensor board to a micro:bit using the alligator clip jumper leads provided.
- Connect the sensor board to the 9 V battery provided.*
- Check to make sure that the alligator clip jumper leads are correctly attached and that a suitable power supply is being used.**
- The LED display should now begin to display values for classroom temperature, relative humidity and carbon dioxide.
* There should be only one power source for the COZIR sensor array. If using the 9 V battery provided, the micro:bit should NOT be connected to a computer or the micro:bit AAA (3 V) battery pack.
** The micro:bit AAA (3 V) battery pack will NOT work to power the COZIR sensor, which requires 3.5 V to run efficiently – the battery pack does not supply enough power.
- Choose a three-day period in which data collection can occur at the same time each day.
- Ideally, the class will measure, record and upload data on classroom environmental conditions at the same time of day over this three-day period (e.g., 9:00 a.m. Monday, 9:00 a.m. Tuesday, 9:00 a.m. Wednesday).
- If possible, we strongly encourage you to gather classroom data under different conditions (e.g., taking measurement[s] in the morning, at noon, and in the afternoon for 3 consecutive days).
- Data can be collected and uploaded in real time into the Living Space dataset or recorded on BLM 1.3: Data Collection Form and uploaded later (see Data Upload for more information).
- Measurement times are flexible based on your class schedule—create a class data collection protocol that is realistic and feasible, with an emphasis on empowering students to take ownership over their classroom inquiry. For example:
4. ISS Data Collection
In addition to collecting data from their classroom environment, students will also be obtaining data about the environment on board the ISS. Students will read sample ISS data for temperature (°C), relative humidity (%) and carbon dioxide (PPM) from the graphs below:
Recording Data from the ISS
Scientific observation often requires collecting and recording data samples from different points in the day. Below are graphs of the current temperature, relative humidity and carbon dioxide for the International Space Station (ISS) vs. a typical classroom reading.
Hover over the graph below to get the precise environmental values for the current period of day (a.m., midday, or p.m.). The values shown are adjusted to your local time zone.
Using the left side of the charts, record the date, period of day, and values shown, and then enter this into the national shared data set. The right side of the chart gives you a standardized comparison point (typical classroom).
Environment Data (Charts)
Morning Data
Midday Data
Afternoon Data
Morning Data
Midday Data
Afternoon Data
5. Data Upload
Students will upload the data they collected on the environmental conditions in their classroom and on board the ISS into a national dataset. You will need to be logged in to your Let’s Talk Science account to enter and download data. Your login information (username and password) is the same for all Let’s Talk Science programs.
Click on “Inquire” and then “Submit your Data” to access the national dataset.
Extensions
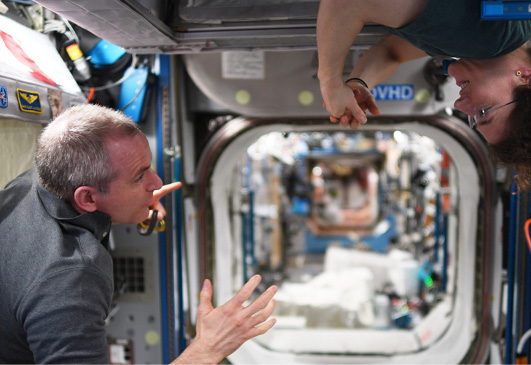
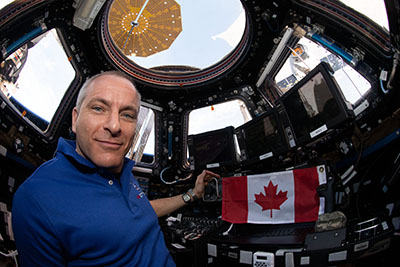
Living on the ISS
Students will learn about David Saint-Jacques’s mission to the ISS and the many milestones he achieved. During or after viewing the video below, students will answer the following questions:
- What was the focus of the Canadian research David Saint-Jacques completed during his mission on the ISS?
- Why is this research important?
- Which environmental factors are monitored on the ISS?
- How is the ISS similar to our classroom? How is it different from our classroom?
You may wish to provide students with the following handout:
- BLM 1.4: Living on the ISS - 1 per student
After watching the video, discuss student responses as a class. Consider seeking answers to further questions about life aboard the ISS using the resources below:
- Inside the International Space Station (NASA Video)
- Leaving Earth (my first trip to space) (CSA Video)
- Living and working in space (CSA Video)
- Why a Trip to Mars Could be Bad for your Bones (Article)
Calibrating the COZIR Sensor
Most sensor instruments need calibration of their measurements from time to time. Use the guided material and video tutorial below to set up and calibrate the COZIR sensor:
- Backgrounder: COZIR Calibration
- The MakeCode program file for the COZIR calibration procedure can be downloaded here: https://makecode.microbit.org/_gapetAMVY8oy
Remote Polling and Displaying of COZIR Readings
This activity requires creating two different programs and using two micro:bits. The micro:bit attached to the COZIR sensor will display data as well as send the data to the remote micro:bit when a button is pressed. The remote micro:bit will poll the source micro:bit for the COZIR data. Once finished, users will be able to place the COZIR sensor array in one location, and then read and control it from a second micro:bit in a different location.
Remote Computer Streaming and Monitoring of COZIR Readings
This activity requires creating two separate programs and using two micro:bits. The micro:bit attached to the remote COZIR sensor will display data as well as send the data to the remote micro:bit that is attached to a computer. The USB connected micro:bit can display a stream of live data and record data to a spreadsheet for graphing and analysis.
Additional Resources
- Canadian Astronaut David Saint-Jacques’s Mission (Accessed March 20, 2023) This section of the Canadian Space Agency website has detailed information about David Saint-Jacques’ 2018–2019 mission.
- Did You Know? The International Space Station (Accessed March 20, 2023) Did you know that November 20 is the “birthday” of the International Space Station? November 20, 2018, was the 20th anniversary of the ISS.
- Environmental Control and Life Support Systems Water Filtration Challenge Educator Guide (Accessed March 20, 2023) This activity from NASA, has excellent background information about the Environmental Control and Life Support System on the ISS and includes a Design & Build activity about water filtration.
- Google Earth: International Space Station (Accessed March 20, 2023) This Google Earth page gives you a 360° view inside the ISS, just like what an astronaut on board would see!
- How to See the Space Station from your Backyard (Accessed March 20, 2023) Did you know that you can see the International Space Station in the night sky as it passes over your area at a distance of approximately 400 km from Earth? This page on the Canadian Space Agency website has a list of websites and applications that can help you track the Station or catch a glimpse of it.
- International Space Station: Space Station Updates (Accessed March 20, 2023) Keep up with all the latest activities onboard the ISS by visiting NASA’s International Space Station home page.
- Living in Space (Accessed March 20, 2023) This section of the Canadian Space Agency website includes links to information about living in space, including eating, sleeping, relaxing and exercising.
- The Vascular Series: Studying Heart Health in Space (Accessed March 20, 2023) This CSA website gives details on three Canadian science experiments that form the Vascular Series: Vascular, Vascular Echo, and Vascular Aging. The focus of these studies is to better understand the effects of weightlessness on astronauts’ blood vessels and hearts aboard the ISS.