Networks of Life
Nerve cells (Neuroglancer gallery)
Nerve cells (Neuroglancer gallery)
How does this align with my curriculum?
Learn about the math behind networks and where we find networks in the natural and technological world.
Consider the people in your class. Each person is an individual with a name. Each of you is friends with other people. Imagine drawing a map of all of these relationships. Who is connected to whom? Where do these connections overlap? What can we learn from mapping these connections?
We call a collection of connected objects a network. In the field of mathematics, a network can also be called a graph. The mathematical theory behind networks is known as graph theory.

Example of four nodes (©2022 Let’s Talk Science).
Image - Text Version
Shown are four yellow circles, spaced apart from each other.
Three of the circles are clustered in the bottom left of the image, with the fourth circle separated from the others in the top right. The circles exist by themselves, with no connections between them.
Did you know?
Nodes can also be called vertices.

Neighbours and edges (©2022 Let’s Talk Science).
Image - Text Version
Shown are four yellow circles with black lines connecting them. Label text is present on the top of the image.
Four yellow circles are spaced apart, with three of them closer together on the bottom left and the fourth set apart from the others in the top right of the image. The yellow circles are connected by black lines so that the image resembles a lopsided hourglass with the bottom missing. At the top, the black line is labeled “Edge”. Blue lines point to the two circles at the top of the image, and above those arrows the label reads “Neighbours” in blue text.

Directed network (©2022 Let’s Talk Science).
Image - Text Version
Shown are four yellow circles, numbered 1 to 4, with black lines connecting some of them.
Three of the yellow circles are clustered in the bottom left, and one is separate by itself in the top right. The three yellow circles in the bottom left are numbered 1, 4, and 2, clockwise. The separate circle in the top right is numbered 3.
Black lines with directional arrows connect the circles. Circle 1 points to circle 2. Circle 2 points to circle 3. Circle 3 points to circle 4.

Undirected network (©2022 Let’s Talk Science).
Image - Text Version
Shown are four yellow circles, numbered 1 to 4, with black lines connecting some of them.
Three of the yellow circles are clustered in the bottom left, and one is separate by itself in the top right. The three yellow circles in the bottom left are numbered 1, 4, and 2, clockwise. The separate circle in the top right is numbered 3.
Black lines connected the circles. Circle 1 is connected to circle 2. Circle 2 is connected to circles 1 and 3. Circle 3 is connected to circles 2 and 4. Circle 4 is connected to circle 3.
Depending on what you’re graphing, the nodes and edges of a network can be different from each other. In the example of your class, you would probably make all the nodes the same, since each one would represent a student. If you were making a graph of a social network, though, you could use nodes to represent accounts.

Weighted graph (©2022 Let’s Talk Science).
Image - Text Version
Shown are four yellow circles, numbered 1 to 4, with black lines connecting some of them.
Three of the yellow circles are clustered in the bottom left, and one is separate by itself in the top right. The three yellow circles in the bottom left are numbered 1, 4, and 2, clockwise. The separate circle in the top right is numbered 3.
The circles are different sizes. Circle 2 is the biggest, followed by circle 1, then circle 3, and the smallest is circle 4
The black lines connecting the circles are also differently sized. The line connecting circles 2 and 3 is the thickest, the circle connecting 1 and 2 is the next thickest, and the line connecting circles 3 and 4 is the thinnest.
Networks and Math
Networks are often represented mathematically as matrices. We call the matrices used in graph theory adjacency matrices.
For undirected networks, the matrix is symmetrical, meaning that the row and a column will add up to the same value.
Consider this network:

Symmetrical network (©2022 Let’s Talk Science).
Image - Text Version
Shown are nine yellow circles, numbered 1-9, and connected with black lines.
The circles are distributed roughly as follows: Circles 3, 4, 5, and 6 are on the left side of the image, circles 2 and 8 are in the middle of the image, and circles 1, 7, and 9 are on the right side of the image.
The circles are connected as follows: Circle 1 is connected to circles 2 and 7; Circle 2 is connected to circles 3, 8, and 1; Circle 3 is connected to circles 2 and 4; Circle 4 is connected to circles 3 and 5; Circle 5 is connected to circles 4 and 6; Circle 6 is connected to circles 5 and 8; Circle 7 is connected to circles 1 and 8; Circle 8 is connected to circles 2, 5, 6, 7 and 9; Circle 9 is connected to circle 8.
The adjacency matrix for this undirected network is represented as:
| Node 1 | Node 2 | Node 3 | Node 4 | Node 5 | Node 6 | Node 7 | Node 8 | Node 9 | Total | |
|---|---|---|---|---|---|---|---|---|---|---|
| Node 1 | 0 | 1 | 0 | 0 | 0 | 0 | 1 | 0 | 0 | 2 |
| Node 2 | 1 | 0 | 1 | 0 | 0 | 0 | 0 | 1 | 0 | 3 |
| Node 3 | 0 | 1 | 0 | 1 | 0 | 0 | 0 | 0 | 0 | 2 |
| Node 4 | 0 | 0 | 1 | 0 | 1 | 0 | 0 | 0 | 0 | 2 |
| Node 5 | 0 | 0 | 0 | 1 | 0 | 1 | 0 | 1 | 0 | 3 |
| Node 6 | 0 | 0 | 0 | 0 | 1 | 0 | 0 | 1 | 0 | 2 |
| Node 7 | 1 | 0 | 0 | 0 | 0 | 0 | 0 | 1 | 0 | 2 |
| Node 8 | 0 | 1 | 0 | 0 | 1 | 1 | 1 | 0 | 1 | 5 |
| Node 9 | 0 | 0 | 0 | 0 | 0 | 0 | 0 | 1 | 0 | 1 |
| Total | 2 | 3 | 2 | 2 | 3 | 2 | 2 | 5 | 1 | 22 |
Where you see a 1, this means that the two nodes are neighbours. For example, in the first row you can see that node 1 is neighbours with nodes 2 and 7. You get the same information whether you read the chart across or down.
Zeros in the chart indicate that the nodes are not neighbours. Where a row and a column meet for a certain node, there will be a zero. This is because a node cannot be a neighbour with itself!
Question 1
Create an adjacency matrix for this network graph.
For directed networks, representing it mathematically is slightly different. Consider the following directed graph:

Directed network (©2022 Let’s Talk Science).
Image - Text Version
Show are eight yellow circles, numbered 1 through 8. Black lines connect the circles, with arrows showing the direction of the connection between circles.
The circles are organized as follows: Circles 5, 8, 1 and 2 form a parallelogram. Circles 6 and 7 are connected to the top of the parallelogram, and circles 3 and 4 form a line coming from circle 2, the bottom right corner of the parallelogram.
Outward connections are: Circle 1 connects into circles 5 and 2; Circle 2 connects into circle 3; Circle 3 connects into circle 4; Circle 4 has no outward connections; Circle 5 connects into circles 6 and 8; Circle 6 has no outward connections; Circle 7 connects into circle 8; Circle 8 connects into circle 2.
In the adjacency matrix for this type of network, the 1s represent the edges, rather than which two nodes are connected. Their position in the matrix is determined by the direction. Nodes that are connected TO are represented as 1s in a row. Nodes that are connected FROM are represented as 1s in a column. This type of network is involved in cases where things move, like robots and characters in video games.
The matrix for the graph above looks like this:
| Node 1 | Node 2 | Node 3 | Node 4 | Node 5 | Node 6 | Node 7 | Node 8 | Total | |
|---|---|---|---|---|---|---|---|---|---|
| Node 1 | 0 | 1 | 0 | 0 | 1 | 0 | 0 | 0 | 2 |
| Node 2 | 0 | 0 | 1 | 0 | 0 | 0 | 0 | 0 | 1 |
| Node 3 | 0 | 0 | 0 | 1 | 0 | 0 | 0 | 0 | 1 |
| Node 4 | 0 | 0 | 0 | 0 | 0 | 0 | 0 | 0 | 0 |
| Node 5 | 0 | 0 | 0 | 0 | 0 | 1 | 0 | 1 | 2 |
| Node 6 | 0 | 0 | 0 | 0 | 0 | 0 | 0 | 0 | 0 |
| Node 7 | 0 | 0 | 0 | 0 | 0 | 0 | 0 | 1 | 1 |
| Node 8 | 0 | 1 | 0 | 0 | 0 | 0 | 0 | 0 | 1 |
| Total | 0 | 2 | 1 | 1 | 1 | 1 | 0 | 2 | 8 |
For example, node 6 has a 1 on row 5. This means that node 5 is being directed to node 6. It is the only incoming connection that node 6 has. Node 2, on the other hand, has two incoming connections, one from node 1 and one from node 8. Node 1 and node 7, meanwhile, have no incoming connections. They only have zeros in their columns. Reading row 7, however, we can see that it directs to node 8, since there is a 1 in the eighth column of row 7.
Similar to the previous graph, where a row and a column meet for a certain node, there will be a zero.
Look what happens when we add up the rows and columns for this type of graph. The rows and columns still add up to the same numbers, but the row and column totals do not match like they did in the symmetrical graph.
Question 2
Create an adjacency matrix for this network graph.
Image - Text Version
Shown are four yellow circles, numbered 1 to 4, with black lines connecting some of them.
Three of the yellow circles are clustered in the bottom left, and one is separate by itself in the top right. The three yellow circles in the bottom left are numbered 1, 4, and 2, clockwise. The separate circle in the top right is numbered 3.
Black lines with directional arrows connect the circles. Circle 1 points to circle 2. Circle 2 points to circle 3. Circle 3 points to circle 4.
Why Have Networks?
Networks are everywhere. You are surrounded by them every day. You are also part of many of them yourself! Networks exist both in nature and in the human-built world.

Bees at a hive (Source: nayneung1 via iStockphoto).
Image - Text Version
Shown is a beehive with several bees crawling over the surface.
The beehive is open to the air and dominates the top half of the image.A large number of bees are crawling over the hive. The background is out of focus, but there are tree branches, green leaves, and sunlight poking through the gaps in the leaves.
Let’s look more closely at some examples of networks.
Networks in the Natural World

Grassland food chain (Let’s Talk Science using an image by Liana Nagieva via iStockphoto).
Image - Text Version
Shown is an illustration of several different types of animals, with a layer of grass at the very bottom. Arrows with direction indicators connect the animals to each other and to the grass.
The grass is the bottom layer and arrows come out of the grass in the direction of a rabbit, a mouse, and an insect (represented by a ladybug). The rabbit is connected to a fox. The mouse is connected into a fox, a hawk, an owl, and a weasel. The insect is connected into a frog. The frog is connected into a weasel, and the weasel is connected into a hawk.
Question 3
What kind of network is shown in the food chain image above?
Scientists who study populations of animals also use networks to show social connections between animals. The image below shows social networks of giraffes (A), rhesus macaques (B), Trinidadian guppies (C) and orcas (D).

Weighted graphs of the social networks of four different animals (Source: Josefine Bohr Brask, Samuel Ellis, Darren P Croft, Animal social networks: an introduction for complex systems scientists, Journal of Complex Networks, Volume 9, Issue 2, April 2021, cnab001, https://doi.org/10.1093/comnet/cnab001).
Image - Text Version
Shown are four different animals, with coloured representations of their social networks next to them. The four animals are a giraffe, a rhesus macaques, a Trinidadian guppy, and an orca.
The giraffe social network is a collection of connected dots with dark blue and light blue colours. Some of the circles are bigger than others. A large collection of these dots is on the right side of the image, a loose small collection in the middle, and a tighter cluster on the left, smaller than the cluster on the right.
The rhesus macaques network is a collection of diamonds and circles coloured dark or light blue. These are clustered on the left hand side of the image, with looser collections around it.
The guppy network is a large, evenly-distributed web with circles of different size and coloured on a gradation of light to dark green.
The orca network is composed of several different sub-networks, all separated from each other and appearing as networks of varying sizes. Each-sub network features circles of different colours and the lines connecting these networks vary in thickness.
Animal networks can get incredibly complicated! This is why representing the various animals using a network graph makes it easier for us to understand.
Question 4
How would you describe the social groups of each of the animals above?

Network of trees (red circles) and fungus (yellow and blue circles) in a temperate forest in Japan (Source: Toju, H., Guimarães, P., Olesen, J. et al. Assembly of complex plant–fungus networks. Nat Commun 5, 5273 (2014). https://doi.org/10.1038/ncomms6273)
Image - Text Version
Shown is a network graph showing a dense cluster of circles of varying sizes and colours in the middle, with a sparser section of connected circles arranged in a rough circle around the cluster in the middle.
Red circles here represent trees, with the bigger circles being bigger trees; blue and yellow circles represent different types of fungi. The connections between trees and fungi are extremely dense, especially in the middle. The sparser section ringing the central cluster is mostly fungi, with three small trees on the right hand side of the diagram.
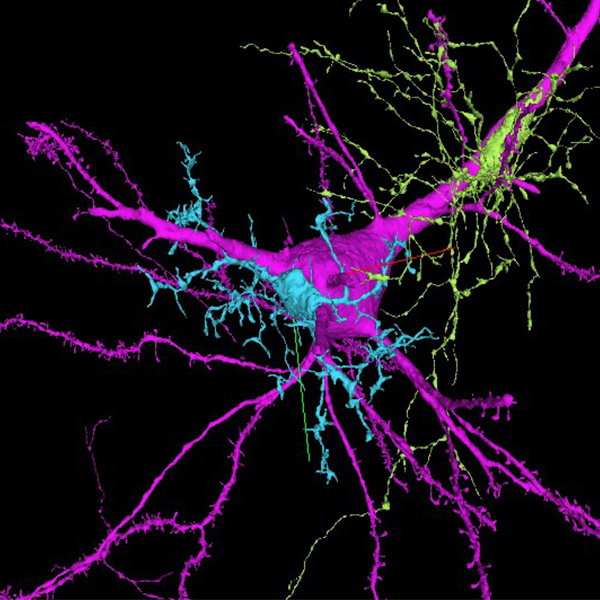
Even the human brain can be thought of as an extremely complex directed network. The brain is made of cells called neurons. These can be represented as nodes in a graph. Neurons are connected together in a network that transmits electrical impulses between them. It has been difficult to see these networks until recently.

Screen capture of neurons (Source: Neuroglancer gallery [CC BY 4.0]).
Image - Text Version
Shown is a computer image of nerve cells connected together. These look like large, lumpy clusters connected by thin strings that have tiny branches growing off of them.
Each nerve cell is coloured a different colour, and the connections coming out of those cells are the same colour as the cell. The collection of cells and connections is very dense, especially in the upper right hand corner of the image.
Did you know?
Brain mapping is the inspiration for the machine learning algorithm called neural networking.
Networks in the Technological World
Technological networks are networks created by people. Like in the natural world, these networks are created to help people share resources and information. Not surprisingly, many human networks are inspired by networks in nature.

Room full of connected computers. The machines are the nodes and the cables are the edges (Source: alacatr via iStockphoto).
Image - Text Version
Shown is one aisle in a server room, with the cabling of the servers and other equipment exposed.
On the right hand side of the image is a long bank of lockers that stretches into the background of the image. Each locker contains several pieces of computer networking equipment, including servers and switches. Multi-coloured cabling runs between the equipment, and also runs out to equipment located outside of the frame. On the left side of the image are a series of lockers whose doors are closed. Above the aisle is a line of white fluorescent lights. At the far end of the hallway sits a brown waste disposal cabinet, with two separate disposal holes.

P2P network (Source: Henrik5000 via iStockphoto).
Image - Text Version
Shown are a large number of symbolic representations of people standing on a light blue board.
Each of the figures has a round circle for a head and a stylized representation of a human body. The figures are all a darker blue than the light blue of the board they are standing on. Each of the figures is standing in a thin blue circle. The circles are connected to each other with dashed lines. The connections are arranged like a network graph, where the figures can be grouped into clusters and not all of the circles are connected to all of the other circles.
Question 5
Where other examples of networks can you think of?
From bee hives to supercomputers, networks are everywhere - and here to stay!
Answers
Question 1
The answer should look like this:
| Node 1 | Node 2 | Node 3 | Node 4 | Total | |
|---|---|---|---|---|---|
| Node 1 | 0 | 1 | 0 | 0 | 1 |
| Node 2 | 1 | 0 | 1 | 0 | 2 |
| Node 3 | 0 | 1 | 0 | 1 | 2 |
| Node 4 | 0 | 0 | 1 | 0 | 1 |
| Total | 1 | 2 | 2 | 1 | 6 |
Question 2
The adjacency matrix should look like this:
| Node 1 | Node 2 | Node 3 | Node 4 | Total out | |
|---|---|---|---|---|---|
| Node 1 | 0 | 1 | 0 | 0 | 1 |
| Node 2 | 0 | 0 | 1 | 0 | 1 |
| Node 3 | 0 | 0 | 0 | 1 | 1 |
| Node 4 | 0 | 0 | 0 | 0 | 0 |
| Total in | 0 | 1 | 1 | 1 | 3 |
Question 3
The food chain graph is an example of a directed network.
Question 4
These animal social networks are examples of weighted graphs.
Question 5
Some other types of networks could include: communications networks (telephone networks or satellite networks); transportation networks (roads or rail as edges, cities as nodes); power networks (as in the electrical grid); water networks (the infrastructure of pipes, reservoirs, and water treatment facilities that deliver clean water); financial networks (money and other investments as edges flowing between companies and investors as nodes); and supply chain networks (goods and services flowing between businesses and suppliers, using transportation).
Learn More
Talking Trees: How do Trees Communicate? (2019)
Learn how trees communicate via fungi and the “wood-wide web”.
The Food Web (2021)
This video (3:38 min.) from Earth Odyssey explores networks called food webs, which consist of many interconnected food chains.
The Earth’s Internet: How Fungi Help Plants Communicate (2018)
This video (5:19 min.) from SciShow discusses how fungi form networks between plants, sometimes networking entire forests.
Social networks and culture in birds (2014)
This video (3:48 min.) from the University of Oxford looks at how birds learn through observation in their social networks, and how those social networks are formed.
References
A Level Biology (n.d.). Food Chains & Networks.
Deriso, D. (Mar 15, 2012). The Artful Brain: Inputs and Outputs of the Neural Machine. Scitable.
Gysi, D. M. and K. Nowick (May 6, 2020). Construction, Comparison and Evolution of Networks in Life Sciences and Other Disciplines. Journal of the Royal Society 17 (166): 0190610
King-Klemperer, A. (Dec 1, 2020). Unexpected Similarity Between Honey Bee and Human Social Life. Illinois Institute for Genomic Biology.
Math Insight (n.d.). An Introduction to Networks.
Ognyanova, K. (2016). Network Analysis and Visualization with R and iGraph. NetSciX 2016 School of Code Workshop
Panchal, S. (Mar 6, 2018). Artificial Neural Networks - Mapping the Human Brain. Medium.
Wild, B., D. M. Dormagen, A. Zacharaie, M. L. Smith, K. S. Traynor, D. Brockmann, I. D. Couzin, and T. Landgraf (2021). Social Networks Predict the Life and Death of Honey Bees. Nature Communications 12.