
Young Entrepreneurs – Math and Your Dream Business
Backgrounders
Learn how entrepreneurs use math when starting a business.

Running Up The Score: The Math In Sports
Backgrounders
Learn some of the math behind basketball and baseball.

Buying Power: The Math Behind Money
Backgrounders
Learn the basics of managing your money.

Data Privacy and You
Lessons
Students will learn about data privacy and how to keep their personal data safe online.

Mairin Deith (she/her)
Career Profiles
Quantitative Ecologist

Understanding Scale: From Planck to Cosmic
Backgrounders
Learn measuring the scale of everything, from the very tiny to the super gigantic!

Petter Wiberg (he/him)
Career Profiles
Managing Director

Data as Art
Backgrounders
Learn about how data can be used to blend math and art.
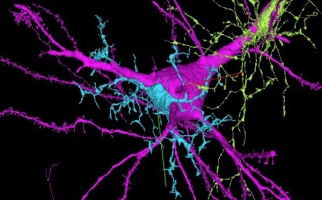
Networks of Life
Backgrounders
Learn about the math behind networks and where we find networks in the natural and technological world.

Rhiannon Cooper (she/her)
Career Profiles
Epidemiologist

Let's Talk Misinformation: Resources
Backgrounders
Discover a set of resources to get you thinking about misinformation and its spread in advance of the symposium Let's Talk Misinformation.
Isha Berry
Career Profiles
Epidemiologist
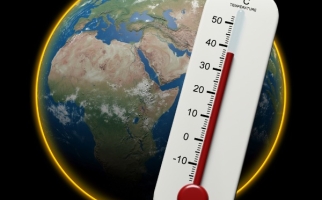
Climate Math
Backgrounders
Learn about how to calculate temperature anomalies as a way of understanding how our climate is changing.

Venn and Euler Diagrams
Backgrounders
Learn about two ways of representing sets - Venn and Euler diagrams.