Understanding Scale: From Planck to Cosmic

Bacteria, whale and universe (©2022 Let’s Talk Science)

Bacteria, whale and universe (©2022 Let’s Talk Science)
How does this align with my curriculum?
Learn measuring the scale of everything, from the very tiny to the super gigantic!
Introduction to Scale
In science we like to measure things. Measuring things is one useful way of getting information or data about that thing.

Bacteria to whale to galaxy (©2022 Let’s Talk Science).
Image - Text Version
Shown is a colour illustration of small particles, a whale, and planets in space.
The image is rendered in shades of blue, magenta and violet. Starting in the lower left corner, small, bright magenta spheres are clumped along a pale blue swirled stripe. Further along the stripe is a whale with a bulbous head. The stripe curves up and around the right side of the image, into outer space. Here, there are several spherical planets in different colours, and tiny white stars.
When it comes to measuring the size of things, scientists need to consider the order of magnitude. This is a logarithmic value relative to a standard value. As the logarithmic scale goes up or down past the standard value, things get bigger or smaller in a consistent, observable way.
The graph below is an example of a logarithmic scale. Notice the values on the Y axis. It starts at 100, and then adds a 0 to the end for each step in the scale. 102 is 100, 103 is 1000, 104 is 10000, and so on.
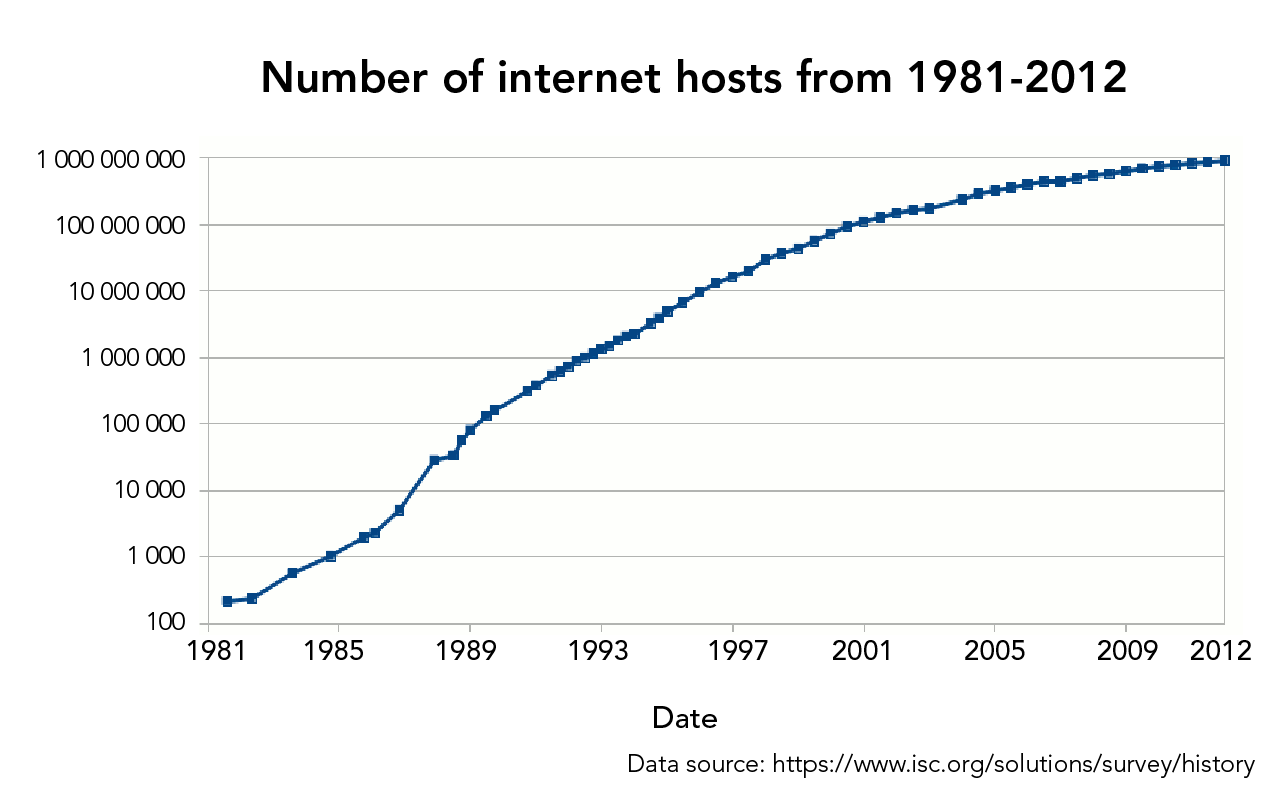
Example of a logarithmic scale, using the growth in internet hosts between 1981 and 2012 (Let’s Talk Science using an image by Ke4roh [CC BY-SA 3.0 via Wikimedia Commons).
Image - Text Version
Shown is a black and white graph with a line rising from 100 to 1 000 000 000, from 1981 to 2012.
The title is in bold letters across the top: "Internet hosts from 1981 to 2012." The x axis is labelled Date. It shows four-year intervals from 1981 to 2012. The Y axis shows numbers from 100 at the bottom, adding a 0 to each number until 1 000 000 000 at the top. The data points on the graph start just above 100 in 1981, and rise on a steady curve to 1 000 000 000 in 2012.
The standard value is often something easy to work with, like 10. The logarithmic value of ten to the power of zero (100) for example, could represent one metre. Anything that is around 1 metre in size could be considered part of this scale. Something that is ten to the power of one (101) would be something that was around 10 metres. This could be something like a tall tree. Things that are of similar size would be part of this scale. We can also have scales that are smaller than 100. Something that is ten to the power of negative one (10-1) would be around 10 cm big. Something ten to the power of negative two (10-2) would be around 1 cm big.
These scales are pretty easy to understand because we can observe things at these scales with our eyes. Once the scales get much bigger and much smaller, we start to need technology to help us view and understand them. For example, when distances get really big, we need telescopes and powerful computers to help us observe and understand them. At the other extreme, when things get really small, we need tools such as microscopes to help us observe.
Image - Text Version
Shown are two square, colour illustrations, one of a telescope, and one of a microscope.
The image on the left shows a white, cylindrical object on a blue background. It has a smaller cylinder on one end. The larger end is tilted up, and the whole thing is attached to a black stand with a large bolt.
The image on the right shows a small, black, cylindrical object, with a smaller silver cylinder attached to the top. This is fastened with a small dial to a white stand shaped like a capital letter G. The large end of the cylinder is angled down toward a thin yellow object sitting on the straight, horizontal line of the G. The background is pale teal.
Let’s look at some of these scales using the orders of magnitude of length and distance as our guide.
Cosmic Scale
At the largest end of the scale is the observable universe. This is an area of the universe around 93 billion light years in diameter. There may be more to the universe beyond this area. If it exists, the light from there has yet to reach us, so it remains impossible to observe. In terms of order of magnitude, the diameter of the observable universe is ten to the power of 26 (1026).
Below the observable universe, there are objects in space that decrease in order of magnitude. This includes:
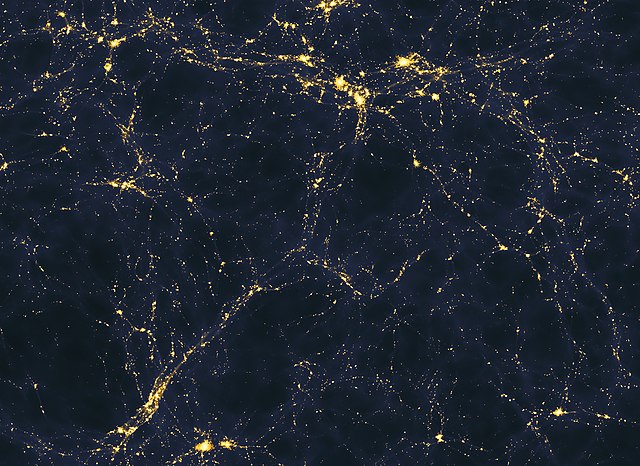
Computer model of galaxy filaments (Source: Andrew Pontzen and Fabio Governato [CC BY-SA] via Wikimedia Commons).
Image - Text Version
Shown is a colour illustration of black space with thin, tangled gold threads running through it.
Some of the threads are bright and clear, while others are barely visible. They are tangled together to create knots of various sizes and shapes. The largest knots are the brightest spots in the image.
Even though both the Pisces-Cetus and Virgo superclusters are in the same scale (1024), they are far from the same size. The Virgo supercluster is around 234 million light years in diameter. The Pisces-Cetus Supercluster Complex is around one billion light years in diameter.
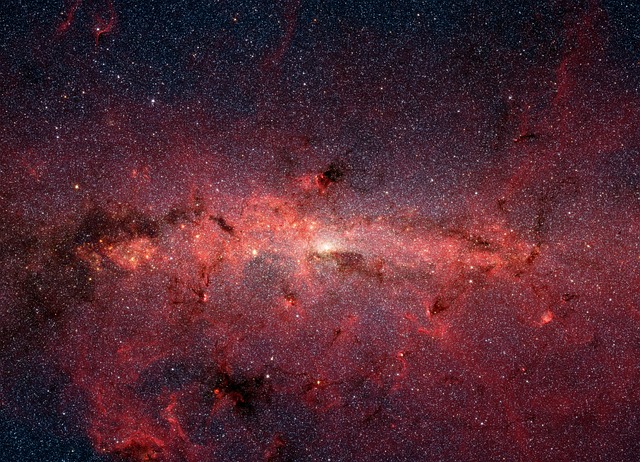
Image of the Milky Way Galaxy (SourceL WikiImages via Pixabay).
Image - Text Version
Shown is a colour photograph of a horizontal, glowing band across space, with a bright white light in the centre.
The band is translucent, made of layers light and colour. It has a reddish pink glow that gets brighter across the middle, and dark, wispy clouds of gas around the outside. A white glow comes from the centre of the image. The space in the background is dark and dense with tiny white stars.
Question 1
The distance from the Earth to the Moon is about 382,500 kilometers. The distance from the Earth to the nearest star, Proxima Centauri, is about 4.2 light-years. How many orders of magnitude larger is the distance to Proxima Centauri than the distance to the Moon?
Below the scale of the solar system are objects you are probably familiar with. This includes planets, moons, and asteroids. We can use orders of magnitude as a scale to measure these as well. The Sun, for example, has a diameter of 109. Jupiter, the largest planet in our solar system, has a diameter of 108. The Earth has a diameter of 107 around the equator.

Deep field image of galaxy cluster SMACS 0723 taken from the James Webb Telescope in July 2022 (NASA)
Image - Text Version
Shown is a colour photograph of black space sprinkled with bright, shining objects.
Some of the objects are bright white and radiate thin beams of light in several directions. Others are gold spheres, or orange swirls and ovals. Some appear blue or red. The largest, brightest object is near the centre of the image.
Human Scale
Below the cosmic scale is the human scale. This refers to the scale at which human beings can see and manipulate objects. Using orders of magnitude, this scale ranges from 106 to 10-6. Thich would be like going from the length of the Trans-Canada to the width of a red blood cell.
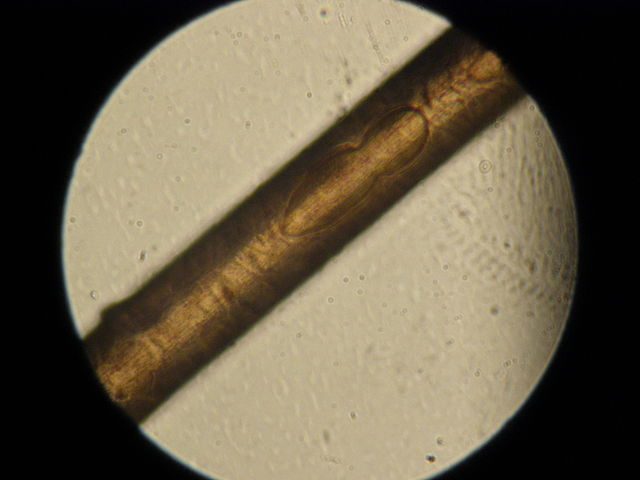
Human hair under a microscope (Source: Juan de Vojníkov [CC 4.0 BY-SA] via Wikimedia Commons).
Image - Text Version
Shown is a colour photograph of a translucent brown tube across a beige circle, framed in black.
The photograph is circular and framed in black. A thick, translucent, brown tube with a shiny texture is stretched diagonally across the circle. The background is beige with tiny black flecks.
Question 2
Suppose you have a graph where the x-axis is marked in logarithmic scale. If the distance between the ticks labeled "1" and "10" is equal to the distance between the ticks labeled "10" and "100," what is the distance between the ticks labeled "100" and "1000"?
Cellular and Atomic Scale
Below human scale are objects and structures that we can only see with the aid of powerful microscopes. Some of these things are so small that we can only detect them by analyzing data gathered from devices like the Large Hadron Collider.
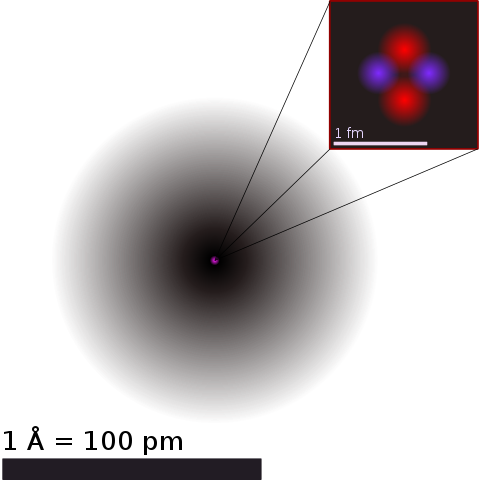
The atomic structure of a helium atom. Note the use of scales here, using both picometres and fentometres (Source: Yzmo [CC 4.0 BY-SA] via Wikimedia Commons).
Image - Text Version
Shown is a colour illustration of a translucent grey circle with a bright, coloured spot at the centre. The spot is magnified in the top right corner.
The circle takes up most of the image. It is darker grey in the middle and fades to white around the edge. At the centre is a tiny dot that looks bright pink. Three thin, black lines lead from this spot to a black square in the top right corner of the image. At the bottom left edge of the image is a black bar that spans about two thirds of the width of the illustration. This is labelled "1 (Angstrom sign) =100 pm."
In the black square, there are four glowing spheres, arranged in a diamond pattern. The ones on the top and bottom are red. The ones on the left and right are purple. The bottom of this square has a white bar that spans about three quarters of the width of the illustration. This is labelled "1 fm."
Scales of length and orders of magnitude continue to get smaller beyond 10-15. At this subatomic level, however, much of the measurement is theoretical. The size of electrons, for example, is suggested to be around one attometre (am), or 10-18.
The smallest measurement found at this scale is the Planck Length. This is 10-35 in orders of magnitude. It is theorized that below this, trying to measure using the scales and instruments we know doesn’t work.
Question 3
The smallest measurable distance is the Planck Length, which has an order of magnitude of 10-35. What would that look like in decimal form, as metres?
Seeing in the Small Scale
Microscopes capable of observing and measuring things below the human scale come in three basic types.
- Optical microscopes use one or more lenses to magnify an object. The limit for an object being examined under a standard optical microscope is around 250 nanometres, or 10-7.
- Electron microscopes use electromagnetic lenses to focus a beam of electrons onto a prepared sample. The limit for this method is around 220 picometres, or 10-10.
- Scanning Probe microscopes use an extremely tiny pointed end and quantum tunnelling to examine surfaces. This allows us to observe objects, such as atoms that can be as small as 100 picometres (10-10).
Measuring objects, whether large or small, requires you to know what kind of scale they fit in. The next time you think about the size of something, consider what scale it would be on.
Question 4
What type of microscope would you use to measure an object around 230 picometres?
Answers
- The distance from the Earth to the Moon is 382 500 kilometers, which is about 3.8 x 10⁵ kilometers. The distance from the Earth to Proxima Centauri is 4.2 light-years, which is about 4.2 x 10¹³ kilometers
The logarithm of 3.8 x 10⁵ to the base 10 is 5, because 105 = 100 000.
The logarithm of 4.2 x 10¹³ to the base 10 is 13, because 1013 = 10 000 000 000 000.
Therefore, the distance from the Earth to Proxima Centauri is 10(13-5) = 108 = 100 000 000 times larger than the distance from the Earth to the Moon. This means that the distance to Proxima Centauri is 8 orders of magnitude larger than the distance to the Moon. - The logarithm of a number to a given base is the exponent to which the base must be raised to get that number. For example, the logarithm of 100 to the base 10 is 2, because 102 = 100.
Since the distance between the ticks labeled "1" and "10" is equal to the distance between the ticks labeled "10" and "100," the distance between the ticks labeled "100" and "1 000" must also be the same. Therefore, the distance between the ticks labeled "100" and "1 000" is equal to the distance between the ticks labeled "1" and "10," which is one unit on the logarithmic scale.
This means that the logarithm of 1 000 to the base 10 is 3, because 103 = 1 000. Therefore, the answer to the problem is 3. - The Planck Length would be written as 0.000 000 000 000 000 000 000 000 000 000 000 01 metre (note that the Planck Length is technically 1.616 x 10⁻³⁵ metres, this question is simplified slightly for ease of use).
- For this type of measurement you would use an electron microscope
Learn More
Powers Of Ten (1977)
This classic video (9:00 min.) from the Eames Office starts at a couple picnicking in a park in Chicago and moves through 40 orders of magnitude, up to the observable universe and then down to the very edge of the subatomic scale.
Orders of Magnitude (2020)
Orders of Magnitude is an educational Virtual Reality experience which will show you our Universe at many different scales (4:29 min.). This video would need to be described to someone with visual impairments.
Orders of Magnitude: Length and Distance
Boston Astronomy has a handy guide to the orders of magnitude discussed above, with examples at each power of ten.
References
Belleville, M. (Nov 25, 2022). Discoveries - Why A Space Telescope. NASA.
Carr, B. J. and S. B. Giddings (2005). Quantum Black Holes. Scientific American.
Cornell Center for Materials Research (n.d.). How do the lenses in a microscope work?
Douglass, E. and C. Miller (2013). Intuiting Biological Scales Using Human Scales. Practically Science.
Electron Nanoscopy Instrumentation Facility (n.d). Electron Microscopy. University of Nebraska-Lincoln.
National Renewable Energy Laboratory (n.d.). Scanning Tunneling Microscopy.
Rachel (n.d.) Size Matters - The Scale of Biology - Examples and Fun Facts. RS Science.
Russell, S. D. (2002). Limits to Resolution in the Transmission Electron Microscope. Principles and Techniques of Transmission Electron Microscopy. University of Oklahoma.