Running Up The Score: The Math In Sports

Basketball player in front of calculations on chalkboard (Peter M. Fisher, Getty Images)
Learn some of the math behind basketball and baseball.
Sports are a fun and exciting way to be entertained and to keep fit.
People have been playing sports for a very long time. Paintings of people wrestling in the Beni Hasan Tomb in Egypt are over four thousand years old!
While sports may seem like a lot of fun and games, there’s serious math involved! Let’s dive in and learn more.
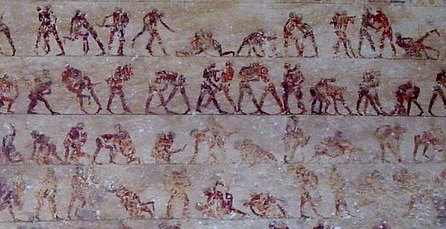
Image - Text Version
Shown is a colour photograph of painted human figures on a stone wall. The dark red figures are in pairs, holding each other in many different positions. They look as if they are standing on four long, horizontal lines that cross the image. The paint is mostly clear on flat, textured grey stone. It fades in the lower rows, where the texture of the stone looks more rough.
Geometry and Basketball
Basketball is a popular team sport. It was invented by Canadian physical education professor Jim Naismith at Springfield College in 1891. One of the reasons why it is so popular is that it is easy to learn. The goal of the game is to throw a ball into a basket above your head. Sounds simple - right? But behind this simple game, there are many connections to math.
One of the best examples of this is the shot. This is when a player throws the ball toward the hoop. When the ball goes into the basket, the player’s team scores points. The key is being able to throw the ball the right distance and at the correct angle to make this happen.
Knowing how far the ball has to travel in the air is an example of how we can use the Pythagorean Theorem in everyday life.
We use the Pythagorean Theorem to help determine the lengths of the sides of right-angled triangles. These are triangles that have a 90 degree angle. Another word for a 90 degree angle is a right angle. We call the side of the triangle opposite the right angle the hypotenuse.
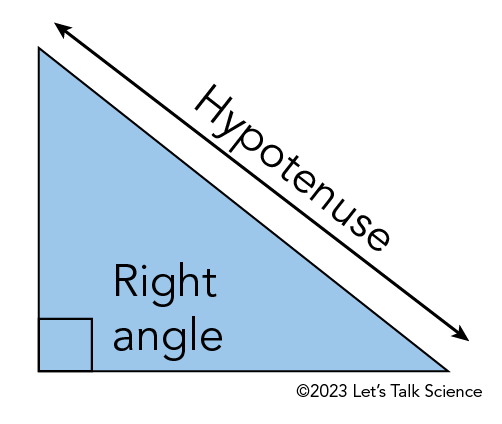
Image - Text Version
Shown is a colour diagram of a right-angled triangle, with the right angle and the hypotenuse labelled. The triangle is blue, outlined in black. Its lower left corner is marked with a smaller, black, right angle line. This forms a square in the corner, labelled “Right angle.” The long side of the triangle, opposite the right angled corner, is labelled “Hypotenuse.”
Let’s see how we could use the Pythagorean Theorem in basketball.
One distance we would need to find out is the horizontal distance from the player to the basket. It is helpful to know that some places on a regulation size basketball court have standard distances from the basket. For example, the free throw line is 4.57 metres (15 feet) from the basket and the three point line is 6.71 metres (22 feet) from the basket.
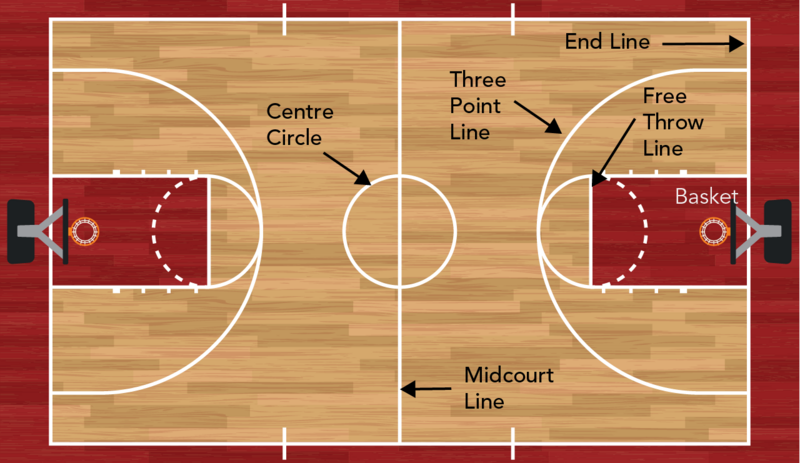
Image - Text Version
Shown is a colour diagram of the basketball court from above. The court is a horizontal rectangle with a basket on each short side. The floor of the court is wooden, and the lines are painted in white. The edges of the court, and the area just in front of each net are painted red. The court is symmetrical, with the lines on each side mirroring each other. A vertical line divides the court in half. This is labelled “Midcourt Line.” A circle across the middle of this is labelled “Centre Circle.” Large arcs curve from each short edge, around the basket and back to the edges. These are labelled “Three point line” and the line at the edge of the court is labelled “End Line.” Inside the three point line, a horizontal red rectangle outlined in white stretches from under the basket, most of the way to the line. The short end of this rectangle, furthest from the basket, is labelled “Free Throw Line.” A small white circle is painted around this line. Half of it is over the red, in a dashed line. The other half is a solid line that intersects with the three point line.
The other distance we would need to find out is the vertical distance from the height where the ball leaves the player’s hand, to the basket. Most players throw the ball above their heads. Some even jump to get more height! The distance a player releases the ball differs from player to player, but the average NBA player has a reach that is about 1.34 times their height. So, someone who is 1.82 metres (six feet) tall could reach up and release the ball at a height of 2.44 metres (eight feet). In addition to the reach, we also need to know the height of the basket. Basketball baskets are almost always around 3.05 m (10 feet) from the ground. This means the distance from the player's hand is the difference between their reach and the height of the basket.
Did you know?
In his game, James Naismith hung peach baskets on a railing that was 3 metres (10 feet) off the ground. So early basketball used actual baskets!
Once we have horizontal distance and the vertical distance, we can figure out the distance from the player’s hand to the basket. This distance is the hypotenuse of the triangle.
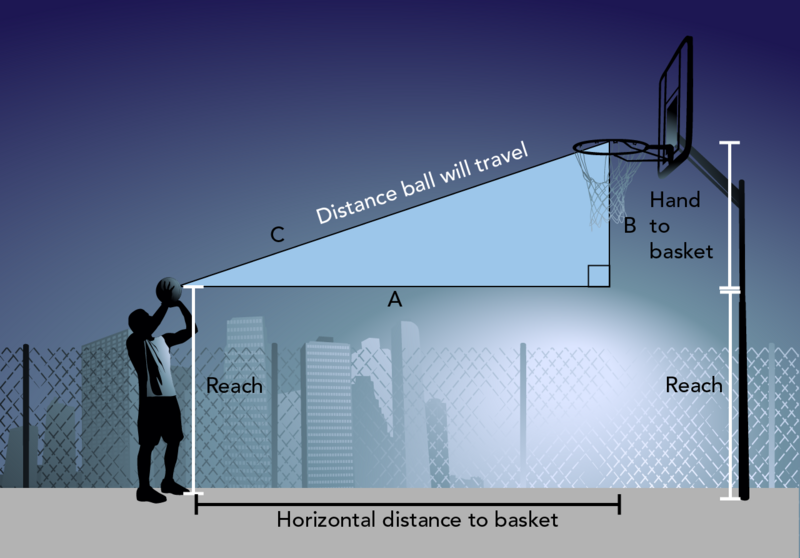
Image - Text Version
Shown is a colour illustration of a person about to throw a basketball, with the distance shown as the hypotenuse of a triangle. The person is shown on the left, silhouetted against a fence with a cityscape in the distance. The distance from the ground to the person’s hands is marked with a white line labelled “Reach.” The distance from the person’s feet to the ground beneath the basket is marked with a black line labelled “Horizontal distance to basket.” The basket is mounted to the top of a pole on the right. The pole is marked with two vertical white lines. The lower one stretches from the ground to the height of the person’s hands. This is labelled “Reach.” The upper line goes from the top of the reach to the top of the basket. This is labelled “Hand to basket.” The corner of the smallest angle of the triangle is at the ball, in the person’s hands. The base of the triangle is labelled “A” and stretches the length of the horizontal distance to the basket. The shorter, vertical side of the triangle is labelled “B” and stretches the distance from hand to basket. The long, diagonal side of the triangle is labelled “C: Distance ball will travel.”
The Pythagorean Theorem states that, for a right angle triangle:
A2 + B2 = C2
If A is the horizontal distance from the player to the basket and B is the vertical distance from the height of the player’s hand to the basket, then we can figure out how far the ball has to fly through the air to reach the basket (C). Let’s say that you’re 1.82 metres (six feet) tall and you’re shooting from the free throw line, which is 4.57 metres (15 feet) away from the basket. The basket is at a height of 3.05 m (10 feet).
A2 + B2 = C2
A = 4.57 m
B = 3.05 m - (1.82 m x 1.34) = 3.05 - 2.44 = 0.61
4.572 + 0.612 = C2
20.88 + 0.37 = C2
21.25 = C2
√21.25 = C
C = 4.61 m
This means the ball has to travel 4.61 m (~15 feet) to get to the basket.
Question 1:
If you’re standing on the three-point line and you’re 1.98m (6.5 feet) tall, how far will the ball have to travel through the air to reach the basket?
Statistics and Baseball
Baseball is an even older sport than basketball. Many different people and places claim they were the first to invent it. Like basketball, Canadians have long been associated with the sport. In fact, some of the first organized baseball leagues sprang up in southern Ontario.
Did you know?
The world’s oldest baseball ground that’s still in use is Labatt Park in London, Ontario.
Professional baseball has been played in North America since 1876. In that time, lots of data has been collected about baseball games. With this data, baseball analysts do a lot of statistics. Statistics is a branch of math that involves collecting, analyzing, and making decisions based on data.
Batting Average
One common statistic that you often see or hear in baseball is a player’s batting average. Sometimes this number is listed beside a batter’s name when they come up to the plate. It’s the number with the decimal in front. A batting average is a measure of how often a batter can hit the ball and get on base.
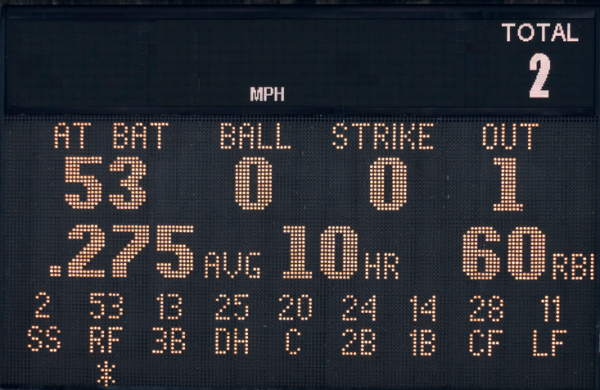
Image - Text Version
Shown is a colour photograph of three rows of labelled numbers and letters in gold pixels on a black background.
The top line of numbers indicates who is currently up to bat and their performance. The first number, labelled "At Bat" on top, is 53. This indicates that the player at bat wears the number 53 on their uniform. The rest of the numbers indicate how many balls, strikes and outs the batter has gotten so far. The number labelled “Ball” is 0. “Strike” is also 0. “Out” is 1.
Below, another row of numbers provides some basic statistics about the player at bat. The first number is ".275 avg", meaning that the player has a batting average of .275. The next is "10 HR", meaning that the player has hit 10 home runs so far in the season. The last is "60 RBI". RBI here stands for "Runs Batted In", meaning the player has driven in 60 runs because of his hitting so far in the season.
The last row of information on the scoreboard is at the bottom. There are nine numbers in this row, representing the player’s uniform number. On the bottom is a series of numbers and/or letters that relate to a player's position. These are, from left to right, "2: SS (shortstop); 53: RF (right field); 13: 3B (third base); 25: DH (designated hitter); 20: C (catcher); 24: 2B (second base); 14: 1B (first base); 28: CF (centre field); 11: LF (left field)." Finally, there is an asterisk beneath "53: RF", indicating that #53, the right fielder, is currently up to bat.
You need two numbers to calculate a batting average. The first is the number of hits the batter has. The second is the number of at-bats or AB. A player gets a “hit” when they hit the ball and reach at least first base without being called out. A player gets an “AB” when they either hit the ball or strike out. If the pitcher walks a batter, they get neither a hit nor an AB.
Once we have the number of hits and the number of ABs, calculating a player’s batting average is easy.
The formula looks like this:
Batting Average = Hits divided by ABs
So, for example, if you got 37 hits in 150 at-bats, the calculation would be:
37 / 150 = 0.247
The result is always a number between 0 and 1. A batting average on its own doesn’t mean much. It’s mainly used to rank and compare players against each other. The example above, 0.247, is about average for hitters in Major League Baseball.

Image - Text Version
Shown is a colour illustration of four labelled numbers in a white box titled “2023 Season Stats.” The first number is .264. This is labelled “AVG” and represents the batting average. Below is the ranking “63rd”. This is his ranking in the league. The second number is 26. This is labelled “HR” and represents the number of homeruns he hit. Below is the ranking “Tied-38th”. This is his ranking in the league. The third is 94. This is labelled “RBI” and represents his runs batted in. Below is the ranking “Tied-34th”. This is his ranking in the league. The fourth is .788. This is labelled “OPS” and represents his On-base plus slugging. Below is the ranking “67th”.
Question 2:
Davis Schneider played for the Toronto Blue Jays as a rookie in 2023. He got 32 hits in 116 AB. What was his batting average?
Baseball analysts look at statistics, like batting averages, to make predictions as to how well batters will do in different situations.
For example, they may use batting averages to find out how a batters does against right-handed pitchers vs. left-handed pitchers. They can also use it to determine if a batter hits better in their home field, or in other ballparks.
Earned Run Average
Pitchers have a similar statistic. It’s called the Earned Run Average, or ERA. This statistic measures how many runs the opposing team scores, on average, against that pitcher in each game. It’s called “Earned Run” because it doesn’t include runs that are scored because of errors made by the pitcher’s teammates.
The formula looks like this:
Earned Run Average = 9 times Earned Runs divided by innings pitched
The 9 is because there are 9 innings in a game of baseball. So, if a pitcher gave up 36 earned runs in 131 innings, you could calculate the ERA like this:
9 x 36 / 131 = 2.47
The pitcher’s ERA would be 2.47. Unlike the batting average, this statistic has a large range. The average for Major League pitchers in 2023 is 4.33. This is about four and a half runs per game.

Image - Text Version
Shown is a colour illustration of four labelled numbers in a white box titled “2023 Season Stats.” The first number is 12-9. It is labelled “W-L” and represents the ratio of wins to loses. Below is the ranking “Tied-23rd”. This is his ranking in the league. The second is 3.16. It is labelled “ERA” and represents his earned run average. Below is the ranking “7th”. This is his ranking in the league. The third is 237. This is labelled “K” and represents his strikeouts. Below is the ranking “2nd”. This is his ranking in the league. The fourth number is 1.18. It is labelled “WHIP” and represents his walks plus hits per inning pitched. Below is the ranking “20th”. This is his ranking in the league.
Question 3:
José Berríos is a starting pitcher for the Toronto Blue Jays. In 2023 he gave up 65 earned runs in 180 innings. What was his ERA?
Both the batting average and ERA have been used for well over a hundred years to measure players against each other. These are only two of dozens of statistics that can be used to rank and compare players. Many of the statistics used in modern baseball are much more in-depth. Some of them can be quite complicated!
Measuring distances and comparing player averages are just two ways in which math plays a role in sports. So the next time you’re watching a sports event, think about all the ways you could describe the action using math!
Answers
Question 1:
If you’re standing on the three-point line and you’re 1.98 metres (6.5 feet) tall, how far will the ball have to travel through the air to reach the basket?
A2 + B2 = C2
A = 6.71 m
B = 3.05 m - (1.98 m x 1.34) = 3.05 - 2.65 = 0.4
6.712 + 0.42 = C2
45.02 + 0.16 = C2
45.18 = C2
√45.18 = C
C = 6.72 m
This means the ball has to travel 6.72 metres (~22 feet) to get to the basket.
Question 2:
Davis Schneider played for the Toronto Blue Jays as a rookie in 2023. He got 32 hits in 116 AB. What was his batting average?
32 / 116 = 0.276
Schneider’s batting average was 0.276.
Question 3:
José Berríos is a starting pitcher for the Toronto Blue Jays. In 2023 he gave up 65 earned runs in 180 innings. What was his ERA?
9 x 65 / 180 = 3.25
Berrios’ ERA was 3.25.
Learn More
The Math Behind Basketball’s Wildest Moves (2015)
This TED Talk video (12:09 min.), from Rajiv Maheswaran, discusses using math and computers to break down probability and how it is used in the game of basketball.
The math behind Michael Jordan’s legendary hang time - Andy Peterson and Zack Patterson (2015)
This TED-Ed video (3:45 min.) uses math to determine how long Michael Jordan was in the air during his famous “dunk from the free-throw line”.
How to Calculate Slugging Percentage and Batting Average! (2015)
This video (4:33 min.) from Mashup Math shows how to calculate a batting average in baseball and also delves into two more related statistics, On-Base Percentage and the Slugging Percentage.
References
Fisher, B. The Physics of Free-Throw Shooting. Secrets of Shooting.
Intuition (2020). How To Shoot The Perfect Jump Shot - Advanced Basketball Math [Video] YouTube.
MacLennan, A. (2021 Dec. 17). Baseball 101: Beginning Batting Stats. Dray’s Bay.
Rymer, Z. D. (2014 Apr. 25). Sabermetrics for Dummies: How-To Guide for MLB Fans to Learn the Ropes. Bleacher Report.
Science Buddies. Basketball: The Geometry of Banking a Basket.
Shaunteaches. (2010). Pythagorean Theorem and Basketball
Sherwood (2023 May 2). The Mathematics of Baseball. Mathnasium.