Venn and Euler Diagrams

Venn and Euler diagrams (Let’s Talk Science)
Learn about two ways of representing sets - Venn and Euler diagrams.
Venn Diagrams
Sometimes we use pictures to draw sets. One type of picture is called a Venn Diagram. Venn diagrams help to show visually the relationships between sets. Typically Venn diagrams have two overlapping circles. But you can draw Venn diagrams with three or more overlapping closed curves. Venn Diagrams do not always show what is in the set specifically. For example, the picture below shows the sets K and L:
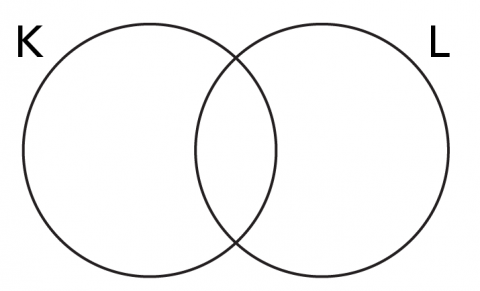
Each circle represents all the elements of the set. With only a picture, you can ask questions about subsets, intersection and union.
Is K ⊆ L (is K inside of L)? NO.
Is L ⊆ K (is L inside of K)? NO.
Questions 1: What is K ∩ L? (What area is inside both sets?) Draw the image and then shade in the picture. Answers are given at the bottom of the page.
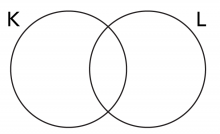
Questions 2: What is K ∪ L? (What is the total area which is in set K, set L, or both?) Shade in the picture to show your answer.

Try these with sets:
E = {1, 3, 8, 9, 14, 17}
F = {0, 14, 3, 5, 10, 20}
Questions 3: Use a Venn diagram to show the sets E and F.
What is E ∩ F?
What is E ∪ F?
Who was Venn?
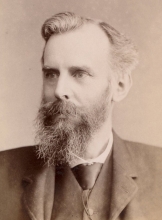
John Venn (1834-1923) was an English logician. A logician is someone who studies ways of logical thinking. He is remembered for inventing the diagram named after him – the Venn diagram.
Venn was brought up by his father who was a Reverend of the Church of England. His mother died when he was very young. He went to Cambridge University where he won a mathematics scholarship in his second year. Even though he was really good at math while at school, after graduating he became a Reverend like his father and grandfather.
Venn never stopped thinking about mathematics. After doing religious work for a few years, he went back to Cambridge where he taught about logic and probability. In 1867 he married and had one son – John. His son John eventually became the president of Queen’s College at Cambridge University where he did important research projects with his father.
Venn's diagrams were first published in 1880 in an article called, "On the Diagrammatic and Mechanical Representation of Propositions and Reasonings." in "Philosophical Magazine and Journal of Science."
Euler Diagrams
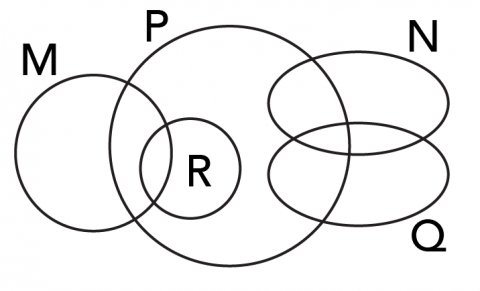
Another way to show sets and their relationships is by using a Euler Diagram. These diagrams are similar to Venn diagrams, but tend to be more complicated. They often show subsets as well as intersection and union. In a Euler diagram, the size and shape of the circles/ovals is not important. What is important is how they overlap or do not overlap.
Question 4:
Is any set a subset (⊆) of another?
If yes, which one?
Question 5:
A) Shade in N ∪ Q

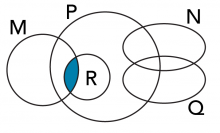
B) Shade in M ∩ R

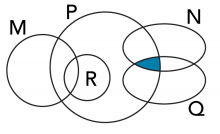
C) Shade in P ∩ N ∩ Q

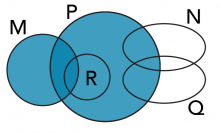
D) Shade in M ∪ P ∪ R

Is N ∩ R possible? No! N and R do not overlap. In set theory, we call this the Null Set or the Empty Set because it contains nothing. The symbol for a null set is ∅. Here is another example of a null set:
G is the number of giraffes in Mrs. Brown’s class. B = { } = ∅
Applications of Venn and Euler Diagrams
Venn and Euler diagrams are useful in a variety of different contexts. Both types of diagrams help us visualize concepts and relationships. This can help us understand complex information more easily. These diagrams use the same structure to represent many different types of content.
For example, Venn diagrams are often used to solve math problems. Representing a question as a Venn diagram can often make it easier to understand and solve. Businesses often use Venn diagrams to compare products, analyze competitors, and make decisions. Venn diagrams represent many other types of practical information, from chemistry to geography. They can even be used for humor or to represent challenging philosophical questions. Venn and Euler diagrams are a simple way to represent all different kinds of information.
ANSWERS
Question 1:
What is K ∩ L? (What area is inside both sets?) Shade in the picture to show your answer.
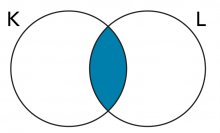
Question 2:
What is K ∪ L? (What is the total area which is in set K, set L, or both?)Shade in the picture to show your answer.
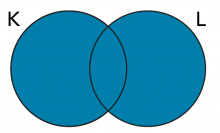
Question 3:
Use a Venn diagram to show the sets E and F.
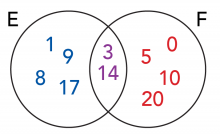
E ∩ F = {3, 14}
E ∪ F = {0, 1, 3, 5, 8, 9, 10, 14, 17, 20}
Question 4:
Is any set a subset (⊆) of another?
If yes, which one?
Yes, R is a subset of P (R⊆P)
Question 5:
A) Shade in N ∪ Q
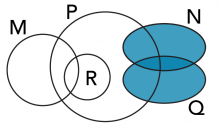
B) Shade in M ∩ R
C) Shade in P ∩ N ∩ Q
D) Shade in M ∪ P ∪ R
Learn More
The mathisfun.com website explains union, intersection and null sets using Venn diagrams. At the bottom of the page are practice questions.
The NRICH website has some practice problems using Venn diagrams. You can do them online or print them off.
Venn Diagrams and Social Media
Try representing social media likes using a Venn diagram in this activity from cK-12.
References
Indeed. (2020, February 4). What is a Venn Diagram and What Is It Used For?.
KidSmart. (2019, September 13). What is a Venn Diagram and When to Use It?.
