Fibonacci and Golden Ratio

Golden spiral neon sign (Alina Kurianova, iStockphoto)
Learn about the Fibonacci sequence and its relationship to some shapes in nature.
A Pattern in Nature
Have you ever wondered why flower petals grow the way they do? Why they often are symmetrical or follow a radial pattern. There are a lot of different patterns in nature. But one of the most well-known is the golden ratio.

Image - Text Version
Shown is a colour photograph of a flower with white petals spread out around its yellow centre. The closest flower is in sharp focus. Many similar flowers are out of focus in the background. Each one is on a thin green stem. They are growing close together, probably in the wild.
Did you know?
The golden ratio has many different names. The golden section, the golden mean, the golden proportion and the divine proportion are just a few. People have been looking for and seeing this pattern for thousands of years!
The Fibonacci Sequence
So where does this golden ratio come from? It is based on a sequence of numbers that mathematicians around the world have been studying since about 300 BCE.
That’s around when Acharya Pingala, an ancient Indian poet and mathematician, wrote about a pattern of short and long syllables in the lines of Sanskrit poetry. This pattern translates to a sequence of numbers called the mātrāmeru.
The same sequence was named the Fibonacci sequence about 1500 years later. This is when, around 1202, Italian mathematician Leonardo Bonacci wrote about it in his book Liber Abaci. Fibonacci and his writing were important to the development of mathematics in Europe. He helped introduce the Hindu-Arabic or Indo-Arabic number system to many people in the West. This system was much easier than the Roman numerals used in Italy at the time.
Did you know?
Hindu-Arabic or Indo-Arabic numerals are the same number system we use today! The symbols for 0, 1, 2, 3, 4, 5, 6, 7, 8 and 9 developed in India and spread to the Middle East and North Africa. Mathematicians including al-Khwarizmi and al-Kindi first introduced the system to Europe. But it was later popularized by Fibonacci.
In Liber Abaci, Fibonacci wrote about something called The Rabbit Problem. It went like this:
A certain man put a pair of rabbits in a place surrounded by a wall. How many pairs of rabbits can be produced from that pair in a year, if it is supposed that every month each pair begets a new pair from which the second month on becomes productive?
( pp. 283-284, translated from original Latin)
By the end, that walled place would soon be hopping with rabbits! But how exactly would their numbers grow? Fibonacci wrote a series of numbers to solve the problem:
0, 1, 1, 2, 3, 5, 8, 13, 21, 34, 55, 89, 144, 233, 377, 610, 987, 1597, 2584, 4181, …
There are zero rabbits in the first month. In the second month, one pair of rabbits move in, but they don’t have any babies for the first two months. In the fourth month, a new pair of rabbits is born! And another in the fifth. By the sixth month, both the first and second pairs are having a pair of babies every month.
These numbers are growing quickly! But did you notice the pattern? After 0 and 1, each new number is the sum of the two numbers before it. This is the Fibonacci sequence. The individual numbers within this sequence are called Fibonacci numbers.
Question 1
What number comes after 4181 in the sequence above?
Did you know?
“Fibonacci” was Leonardo Bonacci’s nickname. It means “son of Bonacci” in Italian. Guglielmo Bonacci was a merchant and Italian customs official. Leonardo travelled to Algeria with him, where he studied calculation. Later, Fibonacci worked and studied number systems in Egypt, Syria, Greece, Sicily, and Provence.
The Fibonacci sequence can also be expressed using this equation:
Fn = F(n-1) + F(n-2)
Where n is greater than 1 (n>1).
The sequence gets more interesting when we divide each number by the one that comes before it.
For example: 1÷1, 2÷1, 3÷2, 5÷3, 8÷5, 13÷8, and 21÷13.
The answers would be: 1.000, 2.000, 1.500, 1.667, 1.625, and 1.615. Look at those numbers in the bar graph below. The bars are different heights, But as each set of numbers gets larger, the answer gets closer and closer to the same dotted line.
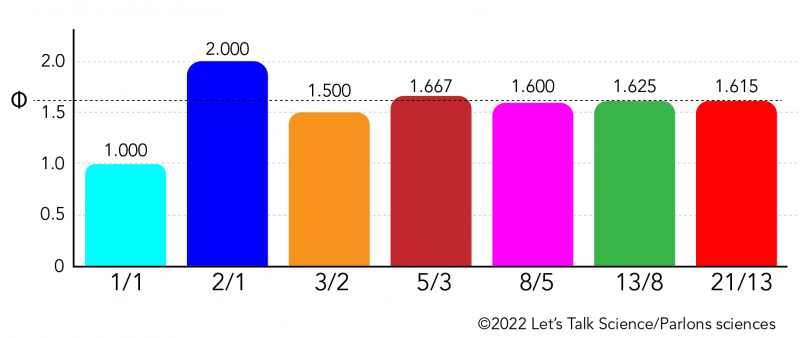
Image - Text Version
Shown is a colour bar graph with 0 - 2.0 on the y axis, and 1/1, 2/1, 3/2, 5/3, 8/5, 13/8, 21/13 on the x axis. From left to right: the bar labelled 1/1 is pale purple and reaches up to 1.0. The bar labelled 2/1 is gold and reaches up to 2.0. The bar labelled 3/2 is bright purple and reaches up to 1.5. The bar labelled 5/3 is dark purple and reaches up to 1.667. The bar labelled 8/5 is orange and reaches up to 1.6. The bar labelled 13/8 is turquoise and reaches to 1.625. The last bar, labelled 21/13 is bright blue, and reaches up to 1.615. These ratios are written in the centre of each bar. A dotted line stretches across the graph, at the level of 1.618033988749895... This is labelled with the symbol for Phi. A circle with a vertical line through the centre.
Question 2
What is the next pair of numbers you could add to the graph above? What would be the value of this ratio?
The dotted line is labelled with the symbol Φ. This is the 21st letter of the Greek alphabet, Phi. In math, Phi represents a number that starts with 1.618033988749895… And goes on forever without repeating! That’s one reason Phi is an irrational number.
Did you know?
An irrational number is a real number that cannot be written as a simple fraction. For example, 1.5 can be written as 3÷2. But you can’t do that with Phi. Pi (3.14159265358…) is also an irrational number.
The Golden Ratio
The Golden Ratio is not the same as Phi, but it’s close! The Golden Ratio is a relationship between two numbers that are next to each other in the Fibonacci sequence. When you divide the larger one by the smaller one, the answer is something close to Phi. The further you go along the Fibonacci Sequence, the closer the answers get to Phi. But the answer will never equal Phi exactly. That’s because Phi cannot be written as a fraction. It’s irrational!
The Golden Ratio can also be seen using two quantities, like the lengths of two line segments. Have a look at the lines below. The blue and green lines have the Golden Ratio. This is because the length of the longer blue line, divided by the shorter green line, is the same as the length of the two lines added together (shown in black) and divided by the blue line. In other words, two quantities have the Golden Ratio if their ratio is the same as the ratio of their sum to the larger of the two quantities.
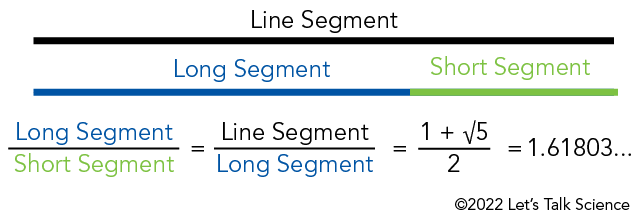
Image - Text Version
Shown is a colour illustration of line segments and a mathematical equation. At the top is a long black stripe labelled Line Segment. Below is a shorter blue stripe labelled Long Segment. To the right is an even shorter green stripe, labelled Short Segment. When placed end-to-end, the blue and green stripes equal the length of the black stripe. The equation is below this illustration. On the left, the words Long Segment in blue is divided by the words Short Segment in green. To the right is an equals sign. Next, the words Line Segment in black is divided by the words Long Segment in blue. This is followed by another equals sign. Next, 1+ the square root of 5 is divided by two. This is followed by another equals sign. To the right, the answer is 1.61803...
A Golden Rectangle works in a similar way. But the quantities are shapes rather than lines. Have a look at the diagram below. The rectangle has a long side of a + b and a short side of a. This is the entire coloured area of the diagram.
Imagine cutting off a square section of this using one line. The square is shown in blue. Each side of its sides is equal to the shortest side of the original rectangle, or a.
But look at the smaller, leftover rectangle shown in pink. This has the same ratio of side lengths as the original rectangle! Even though it’s smaller, it can be divided in the same way as the first.
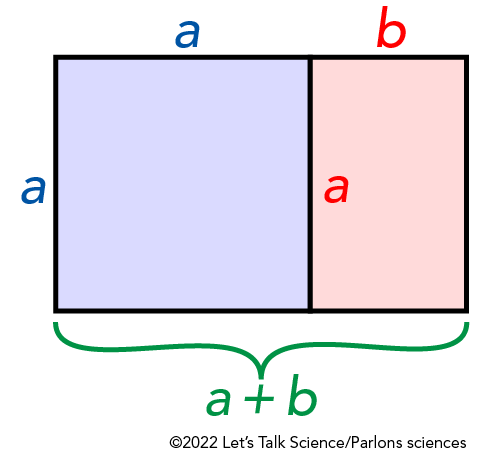
Image - Text Version
Shown is a colour diagram of a rectangle divided into a pale purple square and a smaller pink rectangle. The top and left edges of the square are each labelled with a blue, lower case, italic a. The top edge of the smaller rectangle is labelled with a red, lower case, italic b. The entire bottom edge of the larger rectangle is labelled with a + b, in green italics.
The ratio between sides a and b is Φ or 1.61803… You can see this written as an equation below:
We can grow this pattern by adding a new, larger square to the long side (a + b) of the rectangle. This square, combined with the previous shapes, results in a new, larger rectangle. Do this again and again, and you can create a growing pattern, like the diagram below.
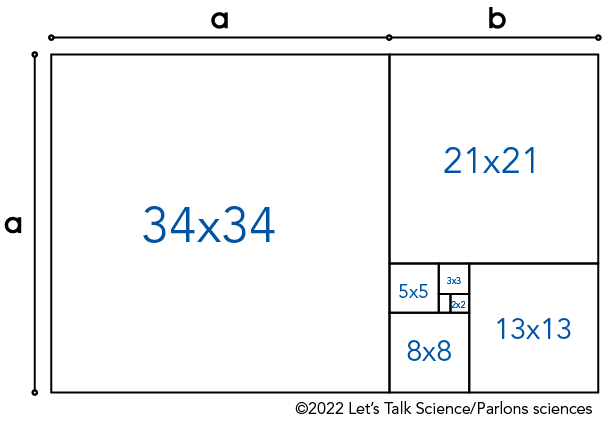
Image - Text Version
Shown is a black and white illustration of a rectangle divided into smaller squares and rectangles that get smaller as they move around the page, towards a spot in the bottom right quadrant. The largest rectangle is divided into many smaller shapes. The largest, on the left, is a square labelled with the number 34. To the right of the square is a vertical rectangle. This is divided into a square, labelled 21, and another, smaller, horizontal rectangle. The third rectangle is divided again. The square in the right is labelled 13. The vertical rectangle is further divided into a square labelled 8, and a horizontal rectangle that is divided again. The next square is labelled 5. Next to it, another vertical rectangle contains a square labelled 3 and a smaller horizontal rectangle, which, in turn, contains a square labelled 2. The smallest square is not labelled, but it looks like this pattern could continue, becoming smaller and smaller with each iteration.
Question 3
How big would the next square be, to continue growing the pattern in the diagram above?
We can take the Golden Rectangle one step further by adding a line that forms a quarter circle in each square.
Have a look at the diagram below. The curved lines connect to form a spiral. This is called a Fibonacci Spiral. Each square is also labelled with the length of its sides. These numbers are the same as in the Fibonacci Sequence!
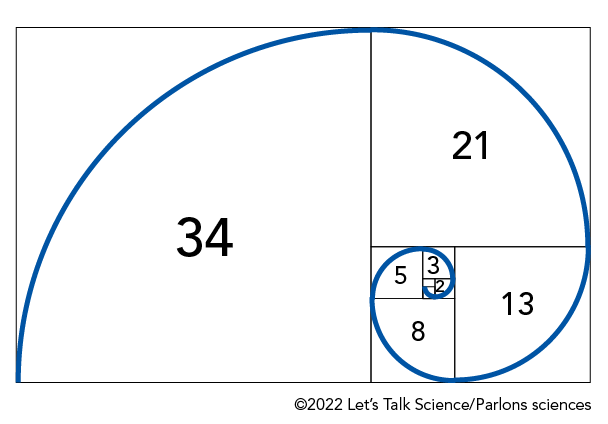
Image - Text Version
Shown is a black and white illustration of a rectangle divided into smaller squares and rectangles, overlaid with a blue spiral line. The largest rectangle is divided into many smaller shapes. The largest, on the left, is a square labelled with the number 34. The blue line over it curves from the bottom left to the top right corner, in a quarter circle. To the right of the square is a vertical rectangle. This is divided into a square, labelled 21, and another, smaller, horizontal rectangle. The square labelled 21 is overlaid with another quarter circle, from the top left, to the bottom right corner. The third rectangle is divided again. The square on the right is labelled 13. It is overlaid with a curved blue line from the top right to the bottom left. The vertical rectangle is further divided into a square labelled 8, and a horizontal rectangle that is divided again. The blue line continues to curl across these shapes. The next square is labelled 5. Next to it, another vertical rectangle contains a square labelled 3 and a smaller horizontal rectangle, which, in turn, contains a square labelled 2. The blue line continues to curl smaller across these shapes. The smallest square is not labelled, but this is the point where the blue spiral ends in a tight curl. The pattern looks as if it could continue, dividing into smaller and smaller shapes, with the spiral becoming tighter and tighter.
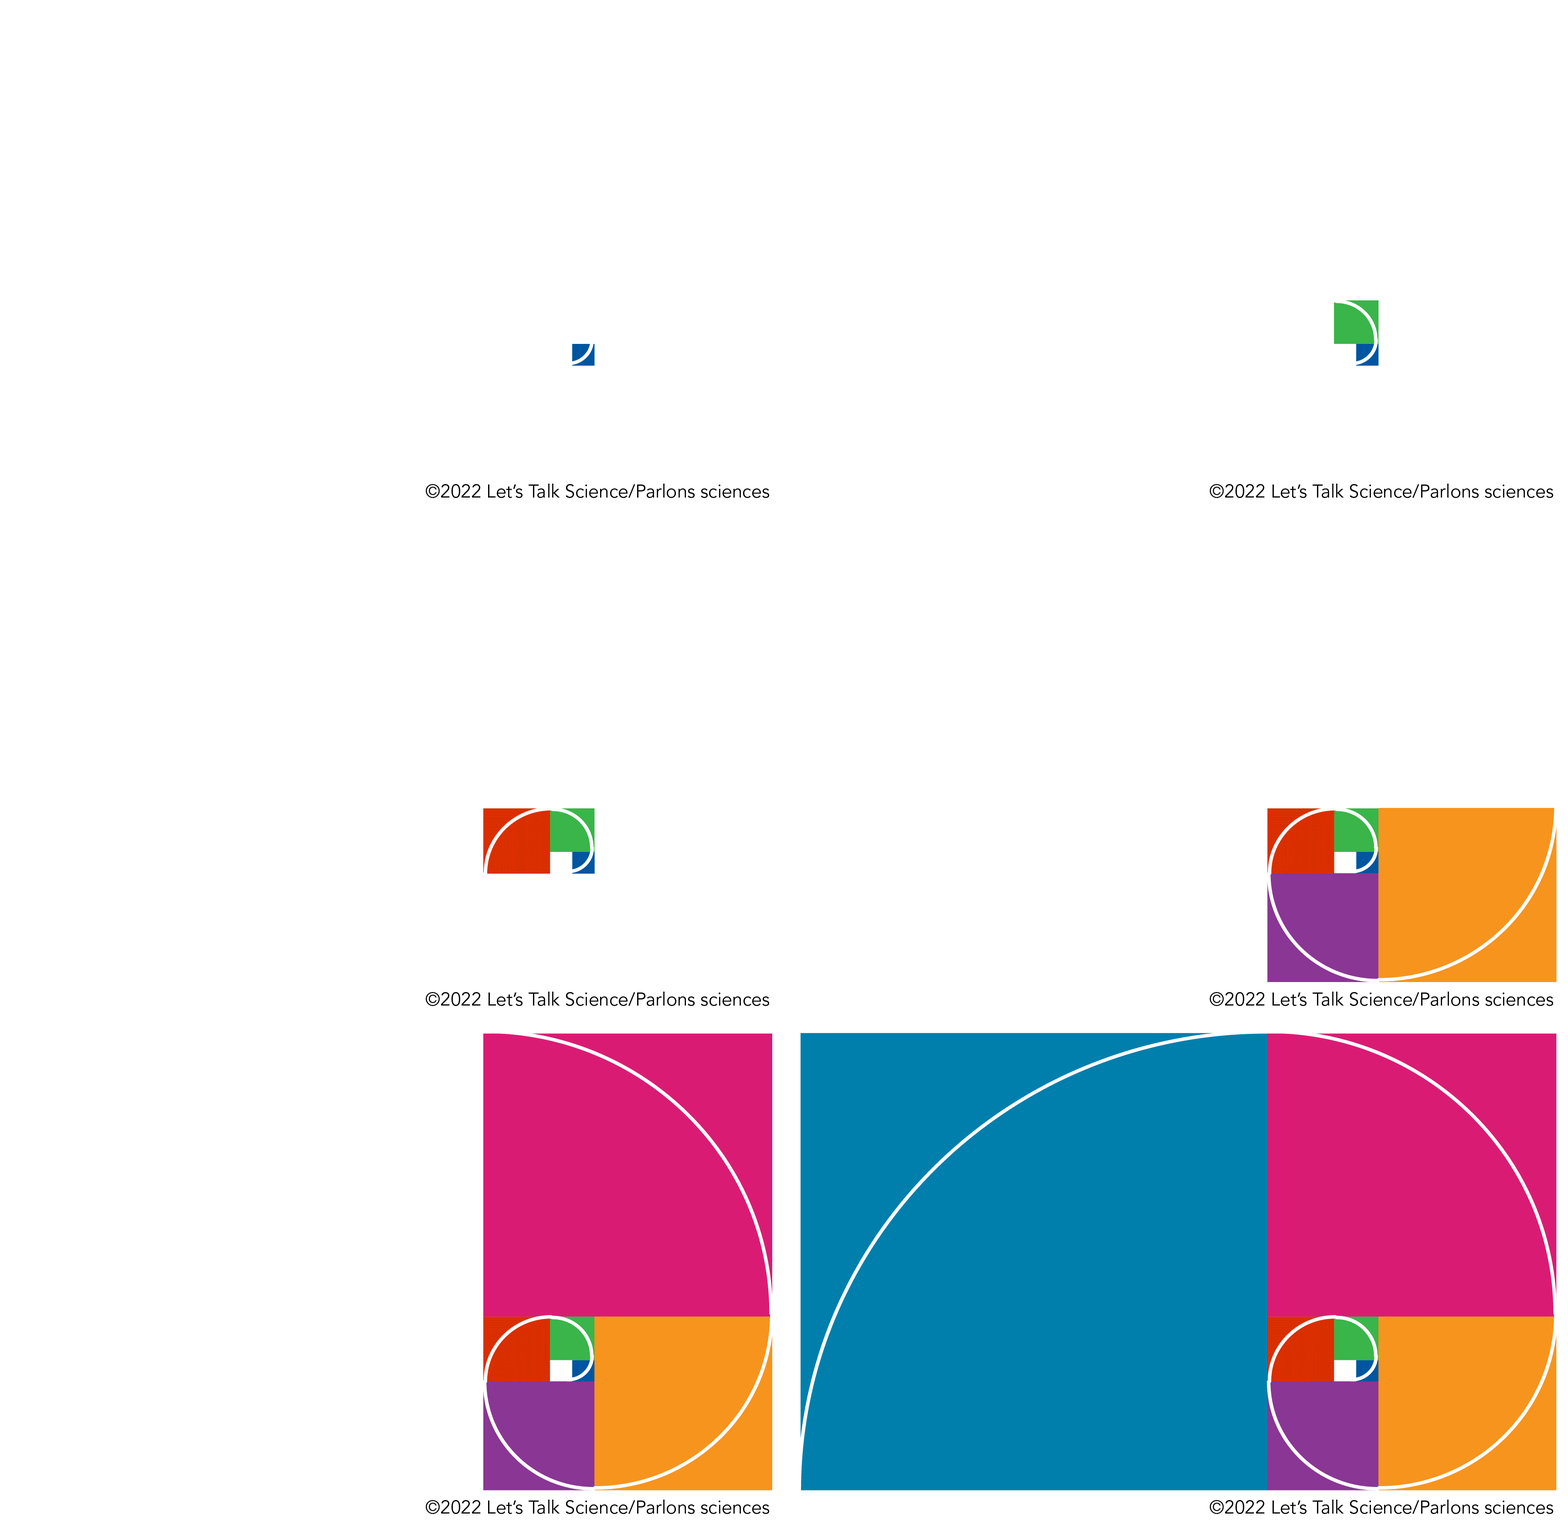
The Golden ratio can also form a spiral (©2022 Let’s Talk Science).
Image - Text Version
Shown is an animated gif of a spiral growing with larger and larger squares of different colours. The first square is tiny and blue, with a curved white line from the bottom left to the top right corner. The second square appears above. It is much larger and the line curves from the bottom right to top left. The third square is larger again. It appears to the left of the rest, and the line curves from the top right to the bottom left. The fourth square appears below the others, with a line from top left to bottom right. The fifth square is orange, and appears on the right, with a line from the bottom left to the top right. The fifth square appears on top of the rest, in pink, with a line from the bottom right to the top left. The final square is so large it takes up more than half the page, and fills in all the space to the left of the rest. It is blue with a line curving from the top right to the bottom left. When all the squares are put together, the curved lines across them form a spiral. This spiral grows out from a tiny blank square in the bottom right corner of the page.
Fibonacci Spirals in Nature
Remember those flower petals? They help draw pollinators to the centre of the flower where the pollen is - like a bull’s eye. This is why many flowers have evolved to grow petals in a Fibonacci spiral around their centres. Each new petals grows about 137.5 degrees away from the last. This is 1 ÷ Phi x 360 (total degrees in the circle). Or you can imagine dividing a circle into two curved lines. The arc of the longer line and the arc of the shorter line have the golden ratio. This is called the golden angle. In fact, if you count all the petals on a flower, you will often find a Fibonacci number!

Image - Text Version
Shown are five colour photographs of different, single flowers, arranged in a row and labelled with their number of petals. The first flower has three wide, pointed white petals and three smaller green leaves. The second has five round, blueish purple petals around a small yellow centre. The third has eight almond-shaped petals that are dark pink near the centre and white at the tips. The fourth has 13 long, narrow yellow petals with curved ends. The fifth has bright long narrow, bright purple petals around a darker purple centre.
But it’s not just petals that follow this pattern. Other plant parts follow the Fibonacci Sequence too. Seeds need enough space to grow properly. Have a look at the sunflower below. The seeds are packed into the centre of the flower in a very familiar pattern!
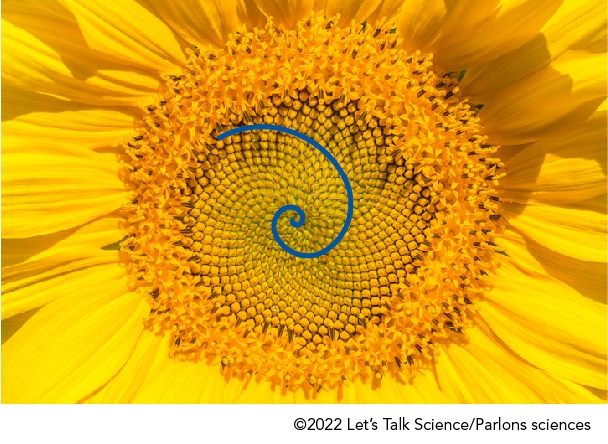
Image - Text Version
Shown is a colour photograph of the centre of a sunflower, with a blue spiral superimposed on it. The flower has bright yellow petals. Its centre consists of tiny, pointed, deep yellow structures, densely packed into a circle. The spiral demonstrates that the tiny pointed structures are laid out in a spiral pattern.
The same pattern can be seen in pinecones and pineapples. If you take the time to count the spirals in each direction, you often find Fibonacci numbers!
Misconception Alert!
Fibonacci Spirals and Golden Spirals are not the same. A Fibonacci spiral is made of squares that increase in size. But a Golden Spiral is made by nesting smaller and smaller Golden Rectangles within a large Golden Rectangle.
The Golden Ratio can be used with other shapes as well. It is possible to find golden ratios in patterns involving circles, triangles, pentagons and other shapes.
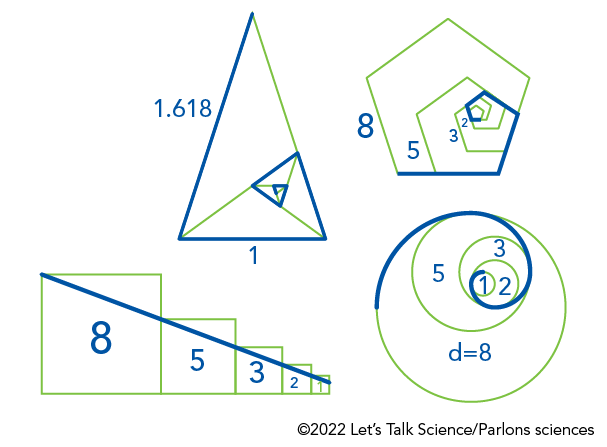
Image - Text Version
Shown is a diagram of intersecting triangles, pentagons, squares and circles with blue lines drawn over them. The largest triangle is acute, and contains seven other, smaller triangles. Its left outside edge is covered by a blue line, labelled 1.618. The blue line turns the corner and continues on its bottom edge, labelled 1. This triangle is divided into an isosceles triangle and a scalene triangle. The scalene triangle is further divided into another acute and another isosceles triangle. The blue line continues around the long, then the short edge of the acute triangle. This triangle is divided again, into another acute and another isosceles. The blue line continues along the base of the acute triangle, which is further divided into another acute and another isosceles. The blue line continues along this base, and the triangle is divided again. The blue line finishes as it turns a tight corner along the base of the smallest acute triangle. In total, the blue line forms a sort of spiral, with a series of acute angles and straight edges that become shorter and closer towards a point in the bottom right of the largest triangle. The largest pentagon is labelled 8. Its bottom edge is covered with a blue line. Inside that, a smaller pentagon is labelled 5 and the blue line continues along one of its edges. Inside this are smaller pentagons labelled 3 and 2, where the line continues along an edge of each. Two even smaller pentagons are unlabelled, but they follow the same pattern. All the segments of the blue line forms a spiral with obtuse angles and straight edges that become shorter and closer towards a point in the lower right of the largest pentagon. The largest square is labelled 8. A smaller one, butted up against it on the right, is labelled 5. A blue line is drawn from the top left corner of the large square, to the top left corner of the smaller square, forming a slope down to the right. Smaller and smaller squares, labelled 3, 2 and 1, follow the same pattern, and the blue line continues in a straight slope down to the smallest square, on the far right. The largest circle is labelled d=8. A blue line covers the upper left part of the circumference. Inside it, smaller circles are labelled 5, 3, 2 and 1. The blue line continues along part of the circumferences of each circle, forming a spiral. This curls to its smallest point in the top right of the largest circle.
So, plants do math! Pretty smart eh?
Answers:
Question 1
What number comes after 4181 in the sequence above?
6765
Question 2
What is the next pair of numbers you could add to the graph above? What would be the value of this ratio?
34/21, 1.619
Question 3
How big would the next square be, to continue growing the pattern in the diagram above?
55x55
Learn More
The Golden Ratio: Is It Myth or Math? (2021)
This video (22:54 min.), by Be Smart, looks at the mathematical reality of the Golden Ratio, and some of the stories around it.
The Golden Ratio (why it is so irrational) (2018)
This video (15:12 min.), from Numberphile, uses flower seed distribution and fractional turns to show what happens numerically when Golden Ratio spirals form.
Rational, Irrational and Real Numbers (2021)
This video (4:35 min.) by Let’s Do Math, provides an overview of the differences between rational and irrational numbers.
References
Be Smart (2021). The Golden Ratio: Is It Myth or Math? YouTube.
Carney-Gies, F. (2023, August 9). Fibonacci. Encyclopedia Britannica.
Cuemath. (2020, September 17). Acharya Pingala.
The Editors of Encyclopedia Britannica. (2023, September 14). Hindu-Arabic numerals. Encyclopedia Britannica.
Haglund, C. (2023, May 3). Flowers & the Fibonacci Sequence. Montana Natural History Center.
Huffman, C. J. (n.d.). Mathematical Treasure: Fibonacci's Liber Abaci. Mathematical Association of America.
Mann, A. (Nov 25, 2019). Phi: The Golden Ratio. LiveScience.
Math Is Fun (n.d.). Nature, The Golden Ratio, and Fibonacci too...
Phyllotaxis (n.d.). Fibonacci Numbers - Golden Angle.
Reich, L. (2013, February 20). Nature follows a number pattern called Fibonacci. Phys.org.
Wikipedia. Pingala.