Observing and Predicting Space Weather in Canada
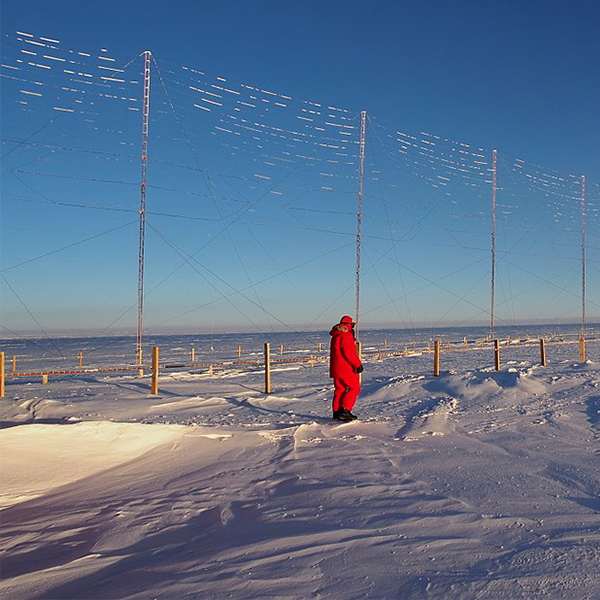
SuperDARN radar station (Paride Legovini, Wikimedia Commons)
SuperDARN radar station (Paride Legovini, Wikimedia Commons)
How does this align with my curriculum?
Learn about how Canadian scientists observe and predict space weather.
A weather forecast usually provides information about clouds, precipitation or wind. But did you know there’s another type of weather forecast? It’s called a space weather forecast!
Space Weather: it all starts at the Sun
Space weather is caused by the Sun. It blasts charged particles (electrons and protons) out in the solar System. This is called the solar wind. Earth’s magnetic field forms an invisible shield that redirects the solar wind around our planet. This magnetic bubble is called the magnetosphere and is thousands of times larger than our planet!
As Earth’s magnetosphere shields us from the solar wind, the magnetic field lines are dragged and stretched by the solar wind. This dragging and stretching causes electric currents as charged particles are pushed around Earth’s magnetic bubble. When the Sun is more active, it sends out more solar wind that buffets the Earth’s magnetic field, which in turn creates stronger electric currents. We call these disturbed conditions geomagnetic storms or space weather storms. Let’s learn about what these storms do on Earth, and how people are working to forecast them.

Image - Text Version
Shown is a colour illustration of wispy orange material blowing from the Sun toward Earth.
The Sun is shown as a glowing orange sphere in the lower left corner. The Sun’s magnetic field is shown as faint orange lines in an apple shape in the space surrounding it. Wispy streaks of orange stream from Sun toward Earth. This creates an orange glow outside the magnetic field, and straight orange lines that fan out towards Earth’s magnetic field. Earth is just visible on the upper right of the image. The tiny planet is surrounded by its huge, purple magnetic field. A small, oval bubble of Earth’s magnetic field faces the Sun, A teardrop-shaped tail of the magnetic juts off to the right, away from the Sun. The field is illustrated in concentric layers in different shades of purple, indicating field lines.
Space Weather and the Ionosphere
The ionosphere plays a very important part in space weather. In this region (from ~60 km up to a few hundred km) some of the air has been split into electrons and ions. This is how the ionosphere got its name. It is an important region for space weather because the electric currents flowing around the magnetosphere can only connect to one another in the ionosphere through horizontal electric currents. Most of the dangers to humans from space weather are because of these horizontal currents flowing a few hundred kilometres above the surface of the Earth.
Did you know?
Auroras happen in the ionosphere when charged particles collide with our atmosphere.
Impacts of Space Weather
In 2012, a powerful coronal mass ejection from the Sun just missed Earth. This was observed by a NASA science satellite called STEREO. If Earth had been in a different position in its orbit, it could have caused billions of dollars in damage.
Space weather can affect electrical power on Earth. In 1989, a solar storm knocked out Hydro-Quebec's electrical grid. This caused a nine-hour power outage. Solar storms do this by overheating and damaging transformers. Transformers increase and decrease the voltage in an electrical system. When they fail, electricity cannot flow through the grid.
Space weather can also damage satellites. People rely on satellites for some TV, Internet, and cell phone services. We also need satellites to use the Global Positioning System (GPS). In 1994, solar storms damaged two Canadian communications satellites. As a result, the company lost millions of dollars. Since then, solar storms have damaged many other satellites.
Space weather influences systems connected with Earth's magnetic field. These include surveying and drilling systems that use the Earth’s magnetic field to pinpoint locations. During solar storms, these systems become less accurate. It can also change the currents in long electrical conductors like power lines and pipelines. This can make the metal in these objects corrode faster.

Image - Text Version
Shown is a colour diagram of solar flare protons affecting different things around Earth.
Earth’s atmosphere is shown as three layers of purple. The darkest layer is furthest from Earth’s surface, and the lightest is closest. Starting in the top layer, there is a satellite and another spacecraft. A long red arrow points down from the top right of the illustration to each one. These are labelled “Solar Flare Protons.” A smaller, green arrow points down to the spacecraft from the top left. This is labelled “Energetic Electrons.” A label here reads “Damage to spacecraft electronics.” Long, jagged blue arrows lead from the satellite down to an airplane just above Earth’s surface, and a tractor in a field on it. In the layer below, a thick yellow arrow pointing left reads “Ionospheric Currents.” To the right, two small blue clouds cross over the arrows from the satellite above. These are labelled “GPS Signal Scintillation.” In the lowest layer, three different arrows point to the large white airplane. The first is the long red one labelled “Solar Flare Protons.” The spot where it meets the plane is marked “Radiation Effects on Avionics.” The second is the jagged blue arrow from the satellite. The third is a pink lightning bolt labelled “HF Radio Wave Disturbance.” A second pink lightning bolt reaches a small building on the ground. Below, a smaller, red, propeller-driven airplane pulls a long cable. This plane has no arrows pointing to it, but it is labelled “Magnetic interference in exploration surveys.” On the ground, starting on the left, a power transmission line is labelled “Geomagnetically induced currents in power systems.” Near the end of this is the building with the pink lightning bolt labelled “HF Radio Wave Disturbance,” pointing to its roof. Below, a yellow line leading to an oil pumpjack is labelled “Telluric currents in pipelines.” To the right, a white line that crosses the water between two land masses is labelled “Induces effects in submarine cables.”
Predicting Space Weather in Canada
Like the weather on Earth, space weather can be forecast. The Canadian Space Agency and Natural Resources Canada are working together to improve space weather forecasting.
The Canadian Space Weather Forecast Centre is a central source of information . Scientists at Canadian universities designed the website and run it. It includes many tools that help scientists predict severe space weather.
One type of information they provide is a long-range solar forecast. This is a 27-day forecast of magnetic activity for three regions of Canada. These are the polar cap, the auroral zone and the sub-auroral zone.

Image - Text Version
Shown is a black and white map of Canada with three concentric circles spread out from the North Pole.
The smallest circle covers most of Canada’s arctic islands. This is labelled “Polar Cap.” The next largest circle includes mainland Northwest Territories, Nunavut, most of Yukon, and northern parts of B.C., Alberta, Saskatchewan, Ontario, Québec and Labrador. This is labelled “Auroral Zone.” The largest circle extends past the edges of the map. This includes the southern parts of the western and prairie provinces, central Canada and all the Atlantic provinces. This is labelled “Sub-Auroral Zone.”
You can explore the predicted activity for each region here.
What do you notice when you look at these three graphs?

Image - Text Version
Shown are three black and white graphs of forecasts for the same dates in three different regions.
Each graph has the same x axes. They are marked with dates from 2023-10-20 on the left to 2023- 11-15 on the right. All the y axes are labelled “DRX (nT),” but each graph includes a different range between 0 and 300. The right edge of each graph is labelled at different levels. The lowest is “Quiet.” The next one up is “Unsettled.” Then “Active.” The highest part of each graph is labelled “Stormy.” Black bars on each graph represent the range of activity for each day. The top graph is titled “Polar.” The y axis here is marked from 0 to 200. The black bars here range from 40-50 at the lower edge, to 70-90 at the top edge. These are mostly in the unsettled area of the graph. The middle graph is labelled “Auroral.” The y axis here is marked from 0-300. The black bars here range from 30-50 at the lower edge, to 70-90 at the top edge. The bottom graph is labelled “Sub auroral.” The y axis here is marked from 0-120. The black bars here range from 0-5 at the bottom edge, to 20-25 at the top edge.
People can also access short-range forecasts and reviews. These cover 24 hours in the past and future. Colour-coding helps viewers understand the level of storm activity.

Image - Text Version
Shown is a colour table with columns for three regions, and rows for six time periods.
The title, “Magnetic Activity Review and Forecast for 2023-11-09 18:45 UT (2023-11-09 13:45 ET) is in bold letters across the top. The columns are labelled, from left to right: “Sub-auroral, Auroral, and Polar.” The columns are labelled, from top to bottom: “24 Hour Review, 6 Hour Review, Current Conditions, 6 Hour Forecast, 24 Hour Forecast, and Following 24 Hour Forecast.” Each cell has one or two phrases describing the level of activity, with a corresponding coloured background. “Quiet” is in green, “unsettled” is in yellow, “Active” is in light orange, and “Stormy” is in dark orange. A wide green text box along the bottom edge reads, “No storm watch in effect.” The review for the sub-auroral region at 24 hours is quiet with unsettled intervals. It is also quiet at six hours and the current time. The six, 24, and following 24 hour forecasts are also quiet. The 24 hour review for the auroral region is unsettled with stormy intervals. The six hour review is quiet with active intervals. Current conditions are quiet. The six hour forecast is quiet with unsettled intervals. The 24 hour forecast is unsettled with active intervals. The following 24 hour forecast is quiet. The 24 hour review for the polar region is quiet with unsettled intervals. The six hour review is unsettled. Current conditions are quiet. The six hour forecast is unsettled. The 24 hour forecast is quiet with unsettled intervals. The following 24 hours forecast is unsettled.
These forecasts warn industries that solar storms are on the way. Airlines can change their flight paths, power companies can adjust their grids, and GPS services can issue alerts. Also, operators can put satellites in safe mode or turn off systems that could be damaged.
Did you know?
Not all space weather phenomena are caused by the Sun! A volcano on Earth erupted in January 2022. It caused a “super bubble” in the ionosphere. This disrupted satellite navigation systems!
Observing Space Weather in Canada
CASSIOPE
Canada observes space weather with a satellite called CASSIOPE, or Cascade Smallsat and Ionospheric Polar Explorer. It uses a group of scientific instruments called ePOP to observe the ionosphere.
ePOP stands for enhanced Polar Outflow Probe.This includes eight scientific instruments. There are plasma imagers, radio wave receivers, magnetometers and cameras.
Professor Andrew Yau of the University of Calgary directs the ePOP project. His team includes researchers and engineers from seven Canadian universities. The Communications Research Centre Canada, the Institute of Space and Astronautical Science of Japan, and the U.S. Naval Research Laboratory are also partners.
Image - Text Version
Shown is a blue hexagon containing a colour illustration of a satellite in space above the aurora.
The satellite is a hexagonal block covered with a shiny blue grid. Grey poles with gold bulbs on the ends extend from three corners and three thin antennae extend from the far side. One wall of the hexagon is gold coloured with a black cylinder. A white beam points from this cylinder toward the curve of Earth, below. In the background, there is a thick streak of green and purple light just above Earth’s blue and white surface. Above, the black space is dotted with tiny white stars. At the bottom edge of the logo, on a white half-circle, are smaller CSA and Cassiope logos.
Geospace Observatory Canada
Geospace Observatory Canada supports researchers as they gather space weather data. This data is used to improve space weather reporting.
Space weather can be observed and understood in different ways. For example, scientists can combine measurements from space and from Earth. They can track radio waves to learn how they are absorbed and reflected by space weather. They can also observe the patterns and locations of auroras. By analyzing all this data, researchers can better understand space weather and its effects on Earth.
Two projects funded by Geospace Observatory Canada are the Super Dual Auroral Radar Network (SuperDARN) and Space Environment Canada (SEC).
SuperDARN
SuperDARN is a global network of radar systems developed by the University of Saskatchewan. Scientists use these radars to monitor conditions in the ionosphere and magnetosphere. This helps researchers see how space weather conditions affect the flow of charged particles in these regions.
SuperDARN operates five radars in Canada. These are in Saskatoon, Prince George, Rankin Inlet, Inuvik, and Clyde River.

Image - Text Version
Shown is a colour photograph of rows of T-shaped towers in a field.
On the right is a straight row of 15-20 tall, thin, silver T-shaped towers. Both the stem and crossbeam of each T are made of metal girders. Another row of four similar towers is visible in the distance, to the left. There is a small grey hut between the two rows. The field is flat with green shrubs and grasses. There is a short barbed wire fence in the foreground, and the sky above is blue with wispy grey clouds.
Space Environment Canada (SEC)
SEC is a leader in research about the ionosphere. They are a Canada-wide network of over 100 ground-based instruments. These provide researchers with a lot of data! This data is freely available. It is used in Canadian and international space missions.
The SEC is based out of Athabasca University, the University of Alberta and the University of Calgary. The SEC uses magnetometers and the instruments below:
- All-sky imagers - specialized cameras that take pictures of the entire sky to study auroras
- Riometers - devices that measure the strength of radio signals coming from space to study the properties of the ionosphere
- Spectrographs - devices that split light into its individual colours and record their intensities. This helps scientists analyze the chemical composition of objects

Image - Text Version
Shown are nine colour photographs of instruments and people, arranged in three rows.
Starting on the top left, the first image shows small white boxes and gold cylinders mounted on a round, silver platter. The second shows snow covered green and white blocks mounted on a silver ring. This is about waist-high in front of a person in a snowsuit. The third image shows a long black cylinder on the floor, with a wire and black switch at one end. The fourth image shows a person in a hat and reflective vest standing next to a tree, waving. The fifth image shows computers and other boxes with wires and cables, mounted on metal shelves inside a plywood shed. The sixth image shows a camera lens pointing up to the sky, mounted on a grey box, with a row of metal towers in the background. The seventh image shows a person looking at a tangle of white cables inside a tall white box, in a workshop. The eighth image shows a bank of small boxes with red and orange lights, in a darkened room. The final image shows a hexagonal pyramid made of silver metal poles, with a silver box mounted at the peak.
Innovative Canadian technologies help advance our understanding of space weather. The more we learn about it, the better we can handle its effects on Earth!
Let’s Talk Science appreciates the support and content validation from the Canadian Space Agency in the development of this backgrounder.
Learn More
What Is Space Weather? (2023)
This page from NASA Science explores space weather.
Welcome to the Ionosphere (2017)
This video (2:59 min.) from NASA Goddard deep dives into the ionosphere.
References
Government of Canada. (2023, Jun. 1). Geospace Observatory (GO) Canada: Monitoring and predicting space weather. Canadian Space Agency.
Government of Canada. (2021, Mar. 22). Space weather effects on technology. Space Weather Canada.
Government of Canada. (2021, Mar. 22). 27 day magnetic activity forecast. Space Weather Canada.
Howell, E., & Whalen, D. (2015, Jun. 3). Caution light: The Anik E2 solar disruption and its effect on Telesat Canada. Science Direct. https://doi.org/10.1016/j.spacepol.2015.02.002.
NASA. (2019, Dec. 10). 10 Things to Know About the Ionosphere.