Precision and Accuracy
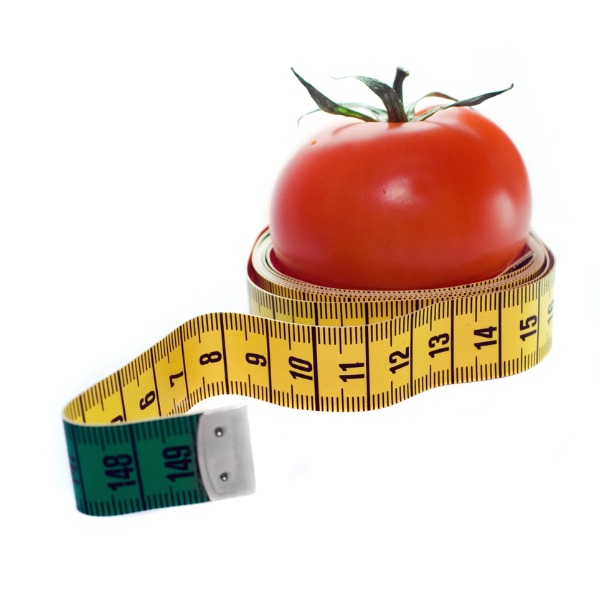
A measuring tape wrapped around a tomato (Michael Bodmann, iStockphoto)
A measuring tape wrapped around a tomato (Michael Bodmann, iStockphoto)
How does this align with my curriculum?
Learn about precision and accuracy and why they are important in science.
Precision and Accuracy
In order to get the most reliable results in a scientific inquiry, it is important to minimize bias and error, as well as to be precise and accurate in the collection of data. Both accuracy and precision have to do with how close a measurement is to its actual or true value.
What is the difference between “Precision” and “Accuracy”?
In everyday life, students may use the terms “precision” and “accuracy” interchangeably, but they have different meanings in math, science and experimental inquiry.
Accuracy
Accuracy refers to how close a measured value is to the actual (‘true’) value. For example, if you were to weigh a standard 100g weight on a scale, an accurate reading for that weight would be as close as possible to 100g. If you got a reading of 105g, then you would say that you were not getting an accurate reading (and your scale would need calibrating).
But what if you don’t know what the “true” value for something is? You still want to be able to take measurements that are as true as possible. Certain devices and tools allow you to be more accurate than others. For example, let’s say that you had two groups of students measuring the width of a tomato plant stem. One group used plastic rulers that only measured to the millimeter (mm). The students had to determine whether they thought the reading was closer to 3 or 4 mm (see below). Another group of students used Vernier calipers to take the measurements. They were able to measure to a tenth of a millimeter. If several measurements are made with a more precise instrument, such as calipers, then the average value can be considered a more accurate value than the one taken with a ruler.
Vernier Caliper

Animated vernier calipers (Source: Joaquim Alves Gaspar [CC BY 2.5] via Wikimedia Commons).
Image - Text Version
Shown is an animated GIF of vernier calipers measuring a nut.
The animation starts with the jaws of the yellow calipers opening. Then a grey, hexagonal nut appears between the jaws. The jaws close against the right and left edges of the nut. Then we zoom in to see the measurements on the calipers. There are two different rulers that measure the opening of the jaws - the top one in centimetres and the bottom one in 10ths of a millimetre. The nut measures 2.4 mm on the top ruler, and 0.07 mm on the bottom ruler, for a total of 2.47 cm. These measurements are labelled on the animation with red arrows.
Plastic Ruler - Less Accurate

Image - Text Version
Shown is a colour photograph of a tomato plant with flowers.
The green, fuzzy stem of a tomato plant stretches from the bottom left corner of the photograph, almost to the top right corner. The stem is thicker at the bottom than the top. There are smaller branches growing off of it, and these have long, dark green leaves with scalloped edges.
In the foreground, another stem with three yellow flowers, is in focus.
Student responses: 3mm, 4mm, 3mm, 4mm
Vernier Calipers - More Accurate
Image - Text Version
Shown is a colour photograph of a tomato plant with flowers.
The green, fuzzy stem of a tomato plant stretches from the bottom left corner of the photograph, almost to the top right corner. The stem is thicker at the bottom than the top. There are smaller branches growing off of it, and these have long, dark green leaves with scalloped edges.
In the foreground, another stem with three yellow flowers, is in focus.
Student responses: 3.5mm, 3.3mm, 3.4mm, 3.5mm
Precision
Precision refers to how close measured values are to each other. For example, one group of students (Group A) counted the number of tomatoes on their tomato plant, while another group of students (Group B) did the same for the tomatoes on their tomato plant.
Group A
How many tomatoes are on the plant?

Image - Text Version
Shown is a colour photograph of a tomato plant with fruit.
The photograph is filled with stems and leaves of tomato plants in various shades of green. In the centre, a stem full of tomato fruit stretches from the top of the image to the bottom. The tomatoes at the top are bright red and the ones at the bottom are pale green.
Student responses: 37, 36, 37, 36, 37, 36
Group B
How many tomatoes are on the plant?
Image - Text Version
Shown is a colour photograph of a tomato plant with fruit.
The photograph is filled with stems and leaves of tomato plants in various shades of green. In the centre, a stem full of tomato fruit stretches from the top of the image to the bottom. The tomatoes at the top are bright red and the ones at the bottom are pale green.
Student responses: 35, 38, 31, 40, 32, 37
Notice that all of the values for Group A are very similar (either 36 or 37). The data would be considered to be very precise. On the other hand, the values for Group B show a much larger range (between 31 and 40). These measurements are not precise.
Precise and Accurate
It is possible to be accurate without being precise and precise without being accurate.

Image - Text Version
Shown is a colour illustration of four bullseye targets with black dots representing shots aimed at each target.
Each bullseye consists of red and white concentric rings, marked with four black dots.
The first bullseye, on the left, has all four dots in the smallest ring, in the centre of the target. This is labelled Accuracy = high, Precision = high.
The second bullseye has all four dots in a cluster near the top right edge of the target, on the two outer rings. The is labelled Accuracy = low, Precision = high.
The third bullseye has four dots spaced around the second ring, just outside the centre of the target. This is labelled Accuracy = high, Precision = low.
The last bullseye, on the right, has four dots scattered around the outside of the target, with one in the third ring, two in the fourth ring, and one in the fifth ring. This is labelled Accuracy = low, Precision = low.
Students should always strive to make measurements that are BOTH accurate and precise.
For example, two sets of data were collected about the surface area of tomato plant leaves.
Accurate AND Precise

Image - Text Version
Shown is a colour photograph of a tomato plant, with a focus on three leaves in the foreground.
The photograph is filled with bright green leaves. In the foreground, three leaves are in sharp, close focus, so their texture is visible. Each leaf is teardrop-shaped, with scalloped edges and a central stem that makes a deep valley from top to bottom. Many smaller valleys branch off from the central one, and even smaller valleys branch off from those. This creates a leathery appearance.
Student responses: 53 cm2, 52 cm2, 53 cm2, 53 cm2
Values are close to each other and close to the average
NOT Accurate and NOT Precise
Image - Text Version
Shown is a colour photograph of a tomato plant, with a focus on three leaves in the foreground.
The photograph is filled with bright green leaves. In the foreground, three leaves are in sharp, close focus, so their texture is visible. Each leaf is teardrop-shaped, with scalloped edges and a central stem that makes a deep valley from top to bottom. Many smaller valleys branch off from the central one, and even smaller valleys branch off from those. This creates a leathery appearance.
Student responses: 47 cm2, 52 cm2, 59 cm2, 56 cm2
Values are not close to each other and some not close to the average
Precision and Accuracy in Tomatosphere™
Accuracy & Precision Hint
To remember which is which, think:
Accuracy = Close to Correct
Precision = Repeatable
In the Seed Investigation, students are encouraged to make both precise and accurate measurements of seed germination. This primarily includes recording precise and accurate data for when the seeds germinate (both seed leaves are up and open). For example, if multiple students count the number of seeds they see germinated on a given day, they should each count the same number of seedlings. In further inquiries with the growing tomato plants, students may measure tomato plants’ height, dry mass, surface area of leaves, width of stems, etc.
Guided Practice
Exercise 1
Have students read and answer the following questions.
- Look at the measurements from the following two groups of students. Which group has the more accurate measurements for the height of the 50 cm plant?
Group A: 49.7 cm, 50.0 cm, 49.8 cm, 50.1 cm, 50.2 cm
Group B: 52.1 cm, 52.0 cm, 52.1 cm, 51.9 cm, 52.0 cm - Look at the measurements from the following two groups of students. Which group has the more precise measurements for the height of the 50 cm plant?
Group A: 49.9 cm, 50.0 cm, 49.8 cm, 50.1 cm, 50.2 cm
Group B: 52.1 cm, 52.0 cm, 52.1 cm, 51.9 cm, 52.0 cm - Look at the following measurements of soil pH from one pot. Are they precise? Explain.
7.0, 5.2, 8.1, 6.3, 7.8
Exercise 2
In their own words, have students define the terms “precision” and “accuracy.”
Exercise 3
Have students identify a real-life example of a situation when precision is important. Have them also identify a situation when accuracy is important.
Exercise 4
Have the students create their own analogy, such as the bullseye analogy used on many websites, to explain the difference between accuracy and precision.
Answers
- Calculate the averages for each group. Group A has an average of 49.82 and Group B has an average of 52. Since the average of Group A is closer to 50 cm than the average of Group B, the values for Group A are more accurate.
- The values for Group B are closer to each other (smaller range) than the values for Group A; therefore Group B has more precise measurements, even though they are not as accurate.
- No, they are not. The range is from 5.2 to 8.1, which is a big difference on the pH scale for soil taken from one pot.
Learn More
What's the difference between accuracy and precision?
This video (4:52 min.) by TED-Ed Animations, explains the importance of both accuracy and precision to scientific inquiry, using William Tell and NASA’s Mars missions.
What Is the Difference Between Accuracy and Precision? - Science Notes
This page, from Science Notes, demonstrates accuracy and precision using target graphics, and explains when each one is most important.
Accuracy and Precision (2012)
This video from Region 10 ESC (2:34 min.) explains how you can have a precise measurement that is not accurate, and an accurate measurement that is not precise. Or worse, a measurement that is both inaccurate and imprecise!