Monitoring the Ocean with Radar
Woman with Canadian flag near the ocean (edb3_16, iStockphoto)

Woman with Canadian flag near the ocean (edb3_16, iStockphoto)
How does this align with my curriculum?
Learn about how a special type of radar helps monitor and protect Canada’s oceans.
Radar is a technology used in many different ways, including by airplanes, ships, meteorologists and the police, just to name a few.
The word RADAR stands for Radio Detection and Ranging. It uses radio waves to help detect and track the distance and speed of many different things.
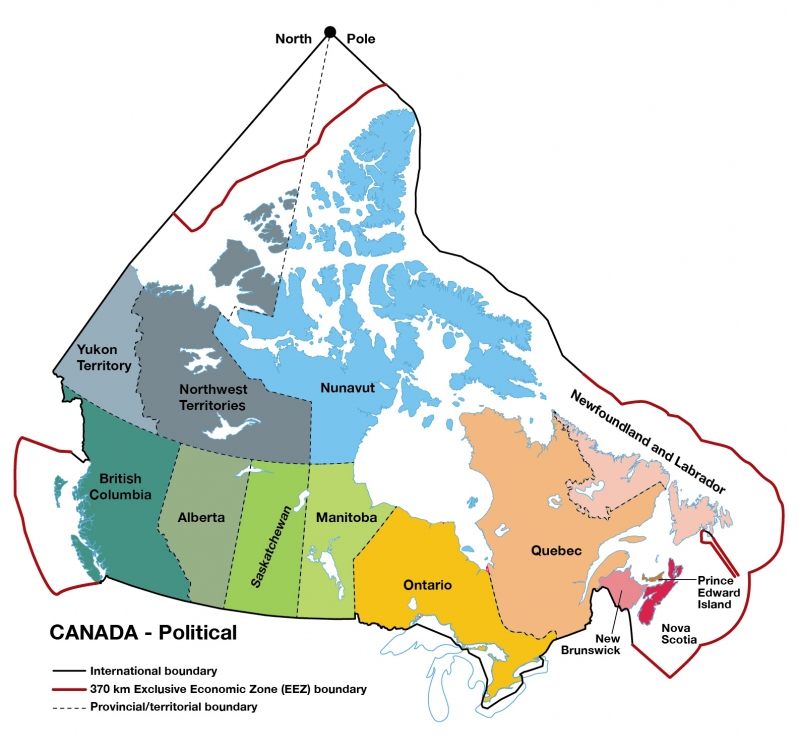
Image - Text Version
Shown is a political map of Canada. Each of the provinces and territories is a different colour. Cooler colours are used in the west and warmer colours are used in the east. The boundaries between provinces and territories are shown using a dotted black line. Extending along the southern border and across the Great Lakes is a solid black line indicating the international border. Jutting into the Pacific ocean from the southern coast of British Colum, travelling northward parallel to the coast and coming back to the coast at the southern coast of Alaska is a red line indicating the EEZ. Northward along the border with Alaska and continuing in a straight line to the North Pole is another black international boundary line. Midway between this line and islands of the northern territories is another red line indicating the EEZ. From the North Pole southward, another black line is found in the waters east of Nunavut. Beginning where this line ends, the line continues as a red line that follows around the coastlines of Newfoundland and Labrador, Prince Edward Island indicating the eastern EEZ. From there the line joined the southern international boundary beginning in New Brunswick.
Did you know?
Canada's EEZ has a surface area of approximately 2.9 million square kilometres.
Because Canada’s EEZ is so large and in some cases very remote, monitoring what goes on in it is a challenge. This is where radar technology comes in.
Radar systems gather information by sending out and receiving that reflect off of objects. Radio waves are waves on the . They range from 300 GHz to around 1 kHz. Hz is the symbol for hertz. Hertz is the unit of in the International System of Units (SI). It is defined as one cycle per second.
Understanding Units of Frequency
One thousand hertz (103) = 1 kilohertz (kHz)
One million hertz (106) = 1 megahertz (MHz)
One billion hertz (109) = 1 gigahertz (GHz).
The range of the radio part of the electromagnetic spectrum is from 1 kilohertz (1 x 10³ Hz) up to 300 gigahertz (3 x 10¹¹ Hz).
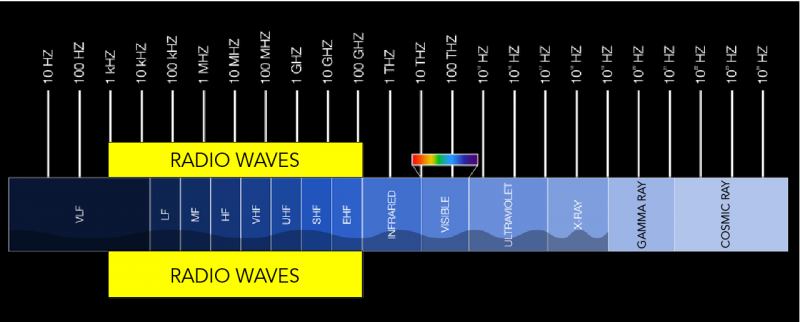
Image - Text Version
Shown is a colour scale displaying the range of wave frequencies from low frequency radio waves to high frequency cosmic rays. The scale, in Hz, is shown against a black background. Each line goes up by a scale of 10 beginning at 10 Hz and going up to 10 to the power of 24 Hz. Above the range identified as visible light is a rectangle filled in with the colours of a rainbow. The order of wave frequency types from left to right is VLF, LF, MF, HF, VHF, UHF, SHF, EHF, Infrared, Visible, Ultraviolet, X-ray, Gamma Ray and Cosmic ray.
The range of waves between 1 kHz and 100 GHz is identified as radio waves. This is shown as black text on a yellow rectangular background. Radio waves have the longest wavelength in the EM spectrum, with a low frequency of 300 gigahertz (GHz). At 300 GHz, the wavelength is about 1 mm (shorter than a grain of rice); at 30 Hz the wavelength is 10,000 km (longer than the radius of the Earth).
Did you know?
are a subset of radio waves. The frequency of microwaves lies in the 300GHz to 300MHz.
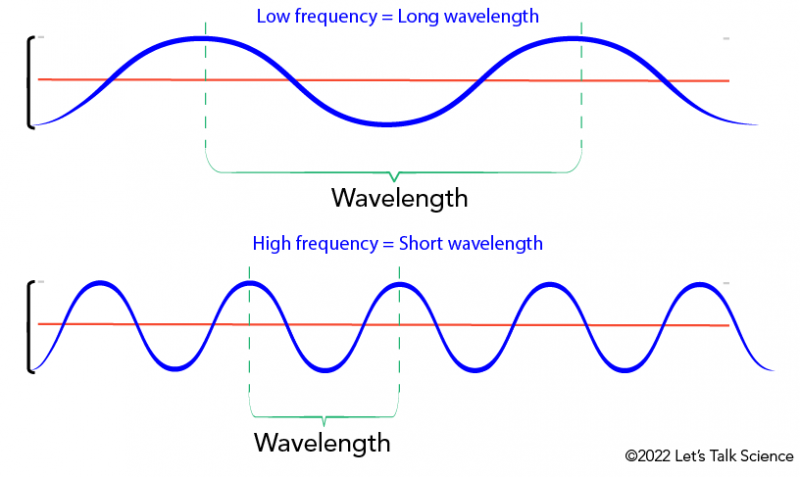
Image - Text Version
Shown are two colourful graphs atop one another. The top one shows a stretched out blue wave with a low frequency and long wavelength. The bottom graph shows a more compressed blue wave with a high frequency and short wavelength.
For this reason, different types of radar use different frequencies. Some common examples are in the chart below.
| Frequency | Examples |
|---|---|
| 3–30 MHz | Coastal radar systems, over-the-horizon (OTH) radars |
| 30–300 MHz | Very long-range air defence radars, ground-penetrating radars |
| 300–1000 MHz | Long-range air defence radars |
| 1–2 GHz | Long range air traffic control radars |
| 2–4 GHz | Airport air traffic control radars, long-range weather radars |
| 4–8 GHz | Satellite transponders, weather radars, long-range tracking radars |
| 8–12 GHz | -guidance radars, radars on ships, weather radars, short-range tracking radars |
| 18–24 GHz |
Traffic speed radars |
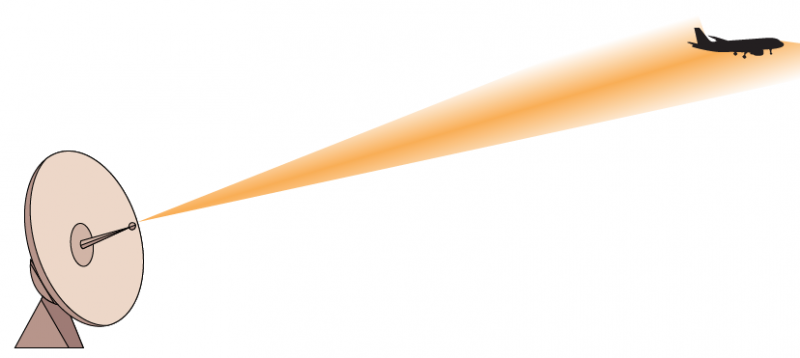
Image - Text Version
Shown is a colour illustration of a radar antenna directed at an aircraft. The antenna is in the bottom left corner. It is an oval attached to a triangular base. An orange-coloured beam appears to be coming out of a projection at the centre of the radar antenna. The beam starts out as a narrow point and widens as it goes towards the top right of the image. At the end of the beam in the top right corner is a black silhouette of a commercial airliner.
Limitations of Radar
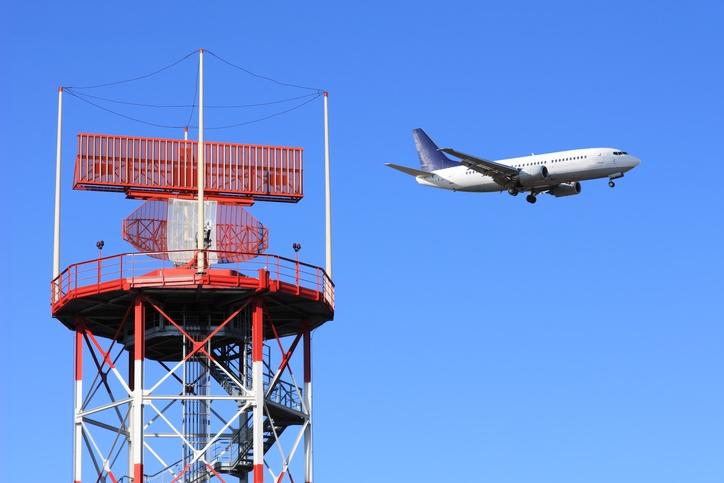
Image - Text Version
Shown is a colour photo of an airport surveillance radar. Against blue skies in the background is an aircraft on the right. The main body of the aircraft is white, while the nose, wings and tail are grey in colour. On the left is a radar atop a red and white tower. The radar consists of a curved dish (primary radar) on the bottom. A horizontal rectangular metal grid (secondary radar) is attached on top of the dish. There is red railing around the perimeter of the radar system.
Another problem with radar has to do with the shape of the Earth. The Earth’s surface appears flat when we look at it from the ground. But we all know that the Earth is a sphere. This is why we can only see so far away. After a certain distance, the Earth’s surface curves away from us. Because light also travels in straight lines, we cannot see things beyond the curve. We call this distance the horizon.
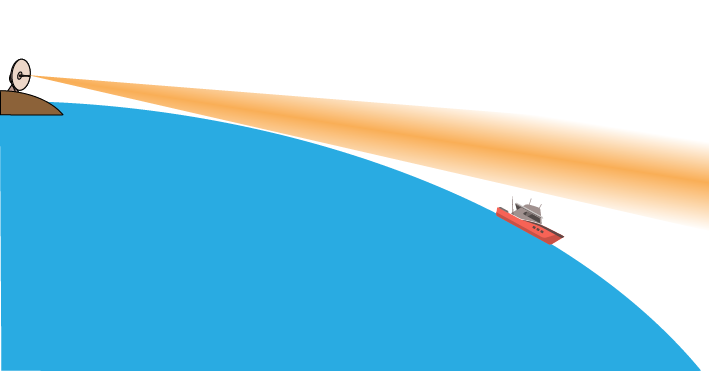
Image - Text Version
Shown is a colourful image of a radar detecting an object from a distance.
A small brown outcropping of land can be seen in the top left of the image. Sitting on the land is the oval disc of the radar antenna. The land sits at the edge of a blue expanse of water that slopes evenly down to the right. An orange beam begins at the radar dish and widens as it goes towards the surface of the water. The place where the radar touches the water is the radar horizon. Past the radar horizon, on the surface of the water, is a small red and grey ship. It is below the radar beam, meaning that the radar beam cannot detect it.
For this, a different type of radar is needed.
Over-the-Horizon Radar
To tackle the problem of distance limits, Over-the-Horizon (OTH) radar was invented. OTH radar tends to use waves with very low frequencies and very long wavelengths. There are two main types of OTH radar. Over-the-Horizon Skywave and Over-the-Horizon Surface Waves.
Over–The–Horizon Skywave Radar
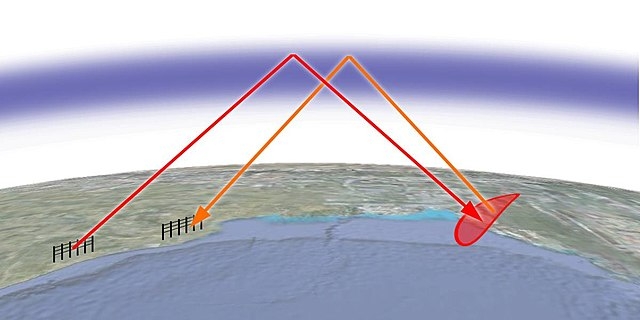
Image - Text Version
Shown is a colour illustration of the refraction or bending of radio waves off the ionosphere. A view of the surface of the Earth is shown in the bottom half of the image. Blue water and greyish landforms are visible. A hazy band of blue that runs parallel to the surface is located midway up the image. This represents the ionosphere.
Two sets of black grid-like radio towers are located on the land towards the left of the image. A red arrow extends upward from the leftmost radar towers, up to the ionosphere where it refracts and heads back down towards the Earth on the right side of the image. A similar orange arrow extends from the other set of radar towers. The area where the two arrows approach land is highlighted with a translucent red oval.
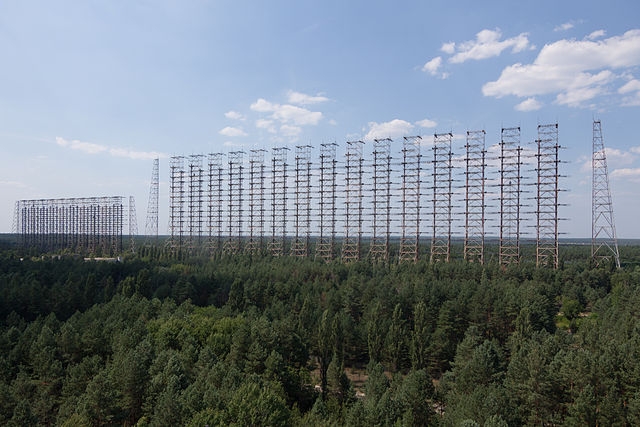
Image - Text Version
Shown is a colour photo of a horizontal row of tall and narrow radar towers. In the background are blue skies with puffs of white clouds and sitting at the foot of the radars, a forest of densely packed evergreens.
Over–The–Horizon Surface Waves (OTH-SW)
Unlike the OTH skywaves, OTH Surface Wave systems use ground waves. Ground waves are radio waves that travel at the boundary between the ground and the atmosphere. Ground waves are often used for long-distance communication.
Did you know?
The Earth is good at transmitting radio waves below 5 MHz.
Ground waves can also be used on the surface of the ocean. A good example of this is Raytheon Canada Limited’s High Frequency Surface Wave Radar (HFSWR). This technology has been in development for more than 25 years with the support of Defence Research and Development Canada.
The HFSWR is a type of coastal radar system. It is used to look for things such as drug trafficking and smuggling as well as illegal fishing and immigration. It can also help assist in search and rescue operations that happen far out in the ocean. In addition to tracking ships, it can be used for scientific monitoring of ocean surface currents, winds and even iceberg movement.
How it Works
HFSWR uses pulses of radio waves between the frequencies of 3 and 30 MgHz. These are much higher frequencies than those used by skywave radar. The lower the frequency, the farther a radar can reach.
Unlike other coastal radars that use straight lines of sight, HFSWR follows the curve of the Earth where the air meets the water.
This gives HFSWR a much greater range than coastal microwave radars.
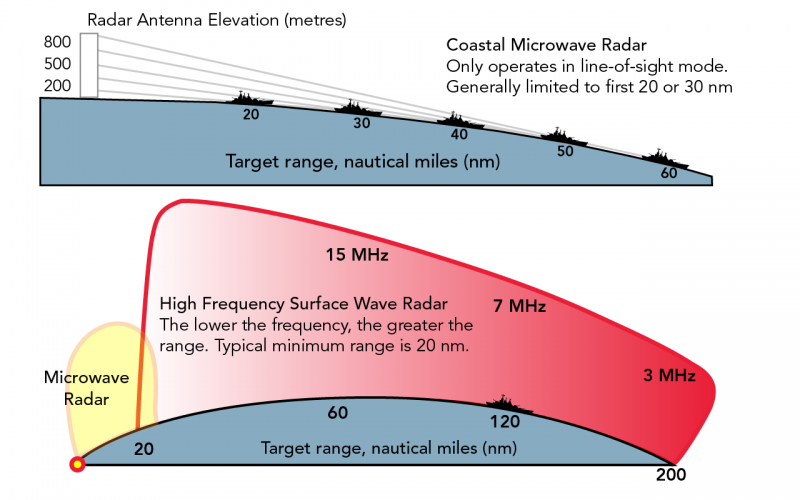
Image - Text Version
Shown is a colour infographic comparing the performance of a coastal microwave radar and HFSWR. The top diagram shows that coastal microwave radar only operates in line-of-sight mode, and generally limited to the first 20-30 nm. The diagram on the bottom shows the minimum range of HFSWR (red section) to 20 nm, and stretches across to 200 nm. A much smaller area (yellow) represents the small range of the microwave radar. The curve of the total range is shown in a light blue on the bottom.
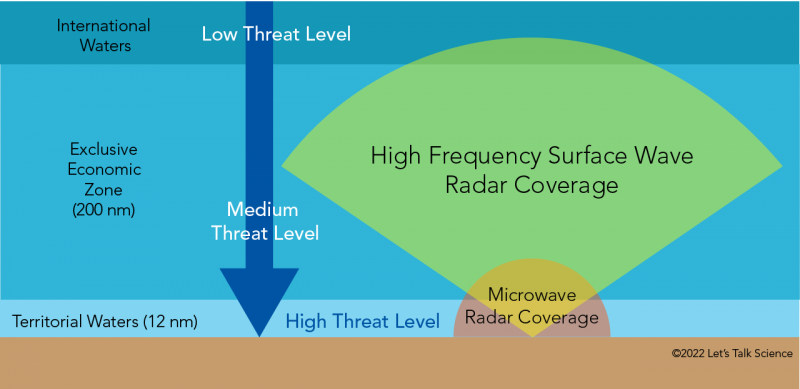
Image - Text Version
Shown is a colour infographic comparing the ranges of coastal microwave radar to HFSWR.
A horizontal bar of brown at the bottom of the image represents land. Above this is a band of light blue that represents Territorial waters. This extends out 12 nm from shore. Within this region is the highest threat level. Above this is a band of medium blue that represents the Exclusive Economic Zone (EEZ). It extends out 200 nm from shore. Within this region is the medium threat level. Above this is a band of dark blue that represents International waters. It extends out beyond the 200 nm limit. Within this region is the lowest threat level. A dark blue arrow that points towards land overlays the blue bands, indicating that the threat level increases as you get closer to land. On the right side of the image is a pink translucent semicircle that has its bottom along the land and its top partway into the EEZ. This represents the range of typical microwave radar coverage. Over top of this is a fan-shaped translucent yellow area that has its lower point touching land. The farthest most part of the shape reaches into territorial waters.
This represents the range of HFSW radar coverage.
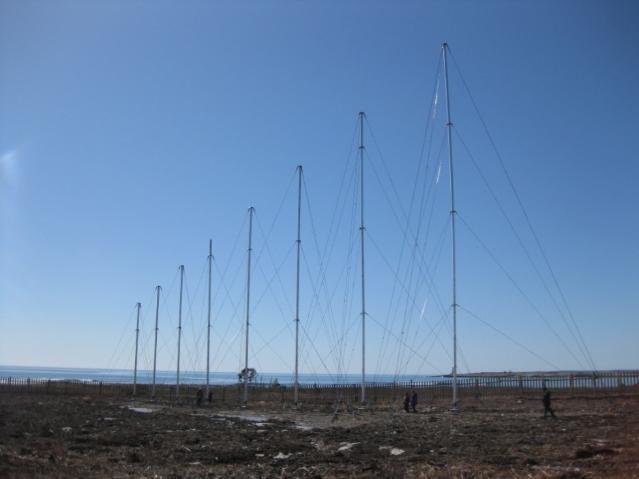
Image - Text Version
Shown is a colourful photo of transmission towers against a clear blue sky, and the horizon of blue waters in the distance. The towers consist of tall posts with sets of wires anchored to the ground. The foreground looks to be an open field with patches of dark green grass and some brown soil.
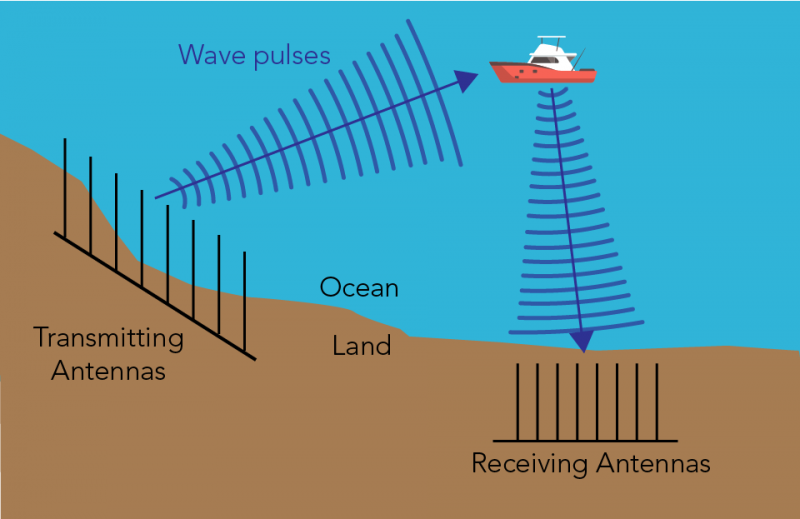
Image - Text Version
Shown is a colour illustration of the process of sending and receiving waves from a ship at sea. The top part of the image is blue ocean and the bottom part is brown land. On land, to the left, are a group of Transmitting Antennas. They send blue wave pulses, represented as curved lines, towards a white and red boat to its right. The waves reflect off the boat downwards towards a set of Receiving Antennas on land to the right of the image.
Did you know?
HFSWR systems have been successfully used in Asia and Europe. The most advanced, 3rd Generation system, is located in Canada.
Let’s Talk Science appreciates the work and contributions of Raytheon Canada in the development of this Backgrounder.
About Raytheon Canada
Raytheon Canada is a subsidiary of Raytheon Technologies. Raytheon Canada is a leader in high technology solutions, engineering services, surveillance and navigation systems including air traffic control radars, highway traffic management systems, maritime surveillance radars and systems, and precision optics.
Learn More
What Are Radio Waves? (2019)
This article from Live Science is all about radio waves.
How Does Radar Work? (2021)
This YouTube video has more information about how radars work and the range of radio frequencies used in radar.
References
American Institute of Aeronautics and Astronautics (n.d.). Radar Frequency Bands.
Brain, M. (n.d.). How the Radio Spectrum Works. How Stuff Works.
Canadian Defence Review (Jan 8, 2019). Maerospace Signs Agreement with Raytheon Canada.
Fisheries and Oceans Canada (2007). Canada’s Ocean Estate: A Description of Canada’s Maritime Zones.
Jem Engineering (n.d). Frequency Bands and Applications.
M. Pan and Chen, B. (2017). MIMO High Frequency Surface Wave Radar Using Sparse Frequency FMCW Signals. International Journal of Antennas and Propagation 2017. https://doi.org/10.1155/2017/7514916<
Moo, P., T. Ponsford, D. DiFilippo, R. McKerracher, N. Kashyap and Y. Allard (2015). Canada’s Third Generation High Frequency Surface Wave Radar System. The Journal of Ocean Technology 10(2): 21-28.
Nikolic, D., N. Stojković, and N. Lekic (2018). Maritime over the Horizon Sensor Integration: High Frequency Surface-Wave-Radar and Automatic Identificaton System Data Integration Algorithm. Sensors 18(4)
Ponsford, A.M. (2015). Canada’s Third Generation High Frequency Surface Wave Radar Using Sparse Frequency FMCW Signals. Conference: Maritime & Arctic Security & Safety Conference (MASS15) "Converging Interests". https://doi.org/10.13140/RG.2.1.1307.5605
Wolff, C. (n.d.). Over-The-Horizon Radar (OTH). RadarTutorial.eu
Wolff, C. (n.d.). Waves and Frequency Ranges. RadarTutorial.eu.
