Weather: Atmospheric Pressure
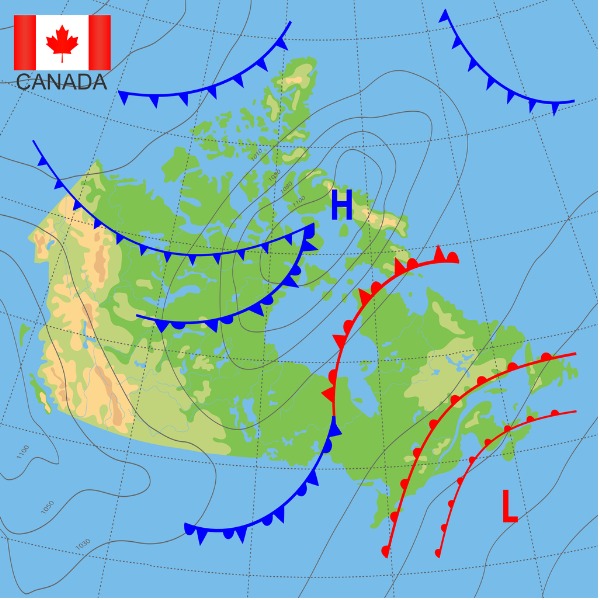
Weather map of Canada (YULIYA SHAVYRA, iStockphoto).
Weather map of Canada (YULIYA SHAVYRA, iStockphoto).
How does this align with my curriculum?
Learn about the layers of the atmosphere, atmospheric pressure, pressure systems and fronts.
There is a layer of gases around Earth. This is our atmosphere.
Did you know?
The word atmosphere comes from two Greek words. Atmómeans vapour and sphaîmeans ball.
Scientists who study our atmosphere describe it with five major layers.

Image - Text Version
Shown is a colour illustration of five layers above Earth’s surface. Earth is shown as a half circle at the bottom centre. It is mostly blue water, with white and green continents. The layers above go from light to dark blue, divided by dotted lines. The first layer above Earth is light blue and labelled “Troposphere.” This contains fluffy clouds and an airplane. The second layer is a bit darker and labelled “Stratosphere.” This contains a bright blue stripe labelled “Ozone Layer” and a large white object labelled “Weather Balloon.” The third layer is darker again and labelled “Mesosphere.” It contains blue clouds and white circles with flaming orange tails, labelled “Meteors.” The fourth layer is labelled “Thermosphere.” It has a bright blue stripe close to the lower edge. This contains brightly coloured streaks labelled “Aurora Borealis,” an astronaut in a space suit labelled “International Space Station,” and a white cylinder with square blue wings labelled “Satellites.” The top layer is the darkest blue and labelled “Thermosphere.” It also has a bright blue stripe near the lower edge. The area above the atmosphere is almost black and labelled “Space.”
| LAYER | HEIGHT | DESCRIPTION |
| Troposphere | 0-14 km | This is the part of our atmosphere that we experience every day. The troposphere is almost 80% of the total mass of the atmosphere. Most of Earth's weather occurs in the troposphere. |
| Stratosphere | 14- 50 km | This is a very stable layer. The air in the stratosphere is very dry. Because of this, there are few clouds here. The ozone layer is in the stratosphere. The ozone layer is very important. It helps protect us from ultraviolet (UV) radiation from the Sun. |
| Mesosphere | 50 - 85 km | Mesosphere comes from the Greek word meso, meaning middle. Most meteors burn up in the mesosphere. Reddish lightning called sprites can sometimes be seen above thunderstorms.These are in the mesosphere. |
| Thermosphere | 85 - 600 km | The Northern Lights (aurora borealis) and the Southern Lights (aurora australis) happen in the thermosphere. This is also where the International Space Station orbits. |
| Exosphere | 600 - 1000 km | The exosphere is the furthest from the surface of the Earth. Its edge marks the edge of space. It contains gas molecules like hydrogen and helium, but they are very far apart. Auroras sometimes happen in the lower exosphere. |
Did you know?
Earth’s atmosphere actually includes the Moon!
Atmospheric Pressure
Our atmosphere plays an important role in weather and wind patterns. It may seem invisible and weightless. But the gases that make up the atmosphere have both mass and weight.
Misconception Alert
Mass and weight do not mean the same thing. Mass is a measure of the number of atoms in an object. Weight is a measure of gravity acting on it.
Atmospheric pressure is the downward force caused by the molecules of air in the atmosphere. Imagine a one square metre column of air that reaches from sea level to the top of the atmosphere. This weighs about 10 000 kilograms! The exact weight of an air column depends on the number and types of molecules it contains.

Image - Text Version
Shown is a colour illustration of a translucent column stretching up from Earth’s surface. Earth is shown as a blue sphere with green and white continents. The base of the column is a white square on the west coast of Africa. The walls of the column up to the white space above the planet. The square top of the column is labelled “1 ㎡ column of air,” and “Mass = 10 000 kg.” A long grey arrow points down from the top towards Earth’s surface. This is labelled “Gravitational Force.”
Air is made of gas molecules. The more gas molecules there are in an area, the more dense the air is. More molecules also mean the air has more weight and pressure. Fewer molecules mean the air has lower density, weight and pressure.
Like all molecules, molecules of gases in the atmosphere are always moving. At higher temperatures, the molecules move quickly and spread out more. This means there are fewer molecules in that area. Fewer molecules result in lower air pressure. The opposite is true at lower temperatures. The molecules stay closer together and the air pressure is higher.
Air pressure is measured with a tool called a barometer.

Image - Text Version
Shown is a colour photograph of a white dial with weather symbols, two numbered scales and two hands. The dial is shown close up. It has a round brass border. The numbers around the edge inside are two circles with numbers and horizontal marks. The numbers around the outside circle start at the bottom and go from 970 to 1040 hPa. The numbers on the inside circle go from 730 to 780 mmHg. Along the top of the circle are three weather icons. On the left are two rainclouds. In the centre is a Sun peeking out from behind a cloud. On the right is a full, round Sun. One hand is thin and brass. This points to 753 mmhg and 1004 hPa, between the rain clouds and the sun and clouds icons. The other is black with an arrow point at one end and a crescent shape at the other. This points to 758 mmHg and 1012 hPa, over the sun and clouds icon.
High and Low Pressure Systems
Atmospheric pressure changes from day to day and from place to place. You might hear a weather forecaster talk about a pressure system or pressure area.
A low pressure system is an area of low pressure surrounded by higher pressure. Air with low density and high temperature is surrounded by air with high air density and low temperature. This causes the air to form an inward spiral. You can see this shape in the picture below.

Image - Text Version
Shown is a colour satellite photograph of a huge swirl of white clouds over Earth. The swirl is centred in the middle of the photograph. Thick, rough streaks of white spiral out from here to the edges of the image. Below the clouds, the ocean is dark blue. A jagged coast of brownish green land peeks out from between the streaks. In the top left corner, a thin black line traces a snowy white coast, almost invisible under the clouds.
Usually, low pressure systems have warm, humid air. They often create clouds and sometimes precipitation. This happens mostly when they run into high pressure systems.
A high pressure system is an area of high pressure surrounded by lower pressure. This means there is cold, dense air surrounded by warmer, less dense air. This causes the air to form a spiral outward. High pressure systems usually cause weather with cool temperatures, dry air and few clouds.
On a weather map, low pressure areas are labelled with a capital L. High pressure areas are labelled with a capital H.

Image - Text Version
Shown is a colour map with six curved lines dotted with shapes across it. The word Canada, and a Canadian flag are in the top left corner. Below, the country is shown in green on a blue background. Thin grey lines trace wobbly concentric oval shapes, diagonally across the country. The centre of these shapes is labelled “H.” The edges of other ovals are visible over the Maritimes, the North Atlantic, and the border with Alaska. Three curved blue lines with triangles along them look like giant false eyelashes over the country. Two are northwest and one is northeast of the H. One curves over the Yukon and Western Arctic, and the triangles point east. A longer one curves from the coast of Northern British Columbia, up to just north of Baffin Island. The triangles here point south and east. The line curves across the blue area northeast of Canada, where Greenland is. These triangles point southwest. A smaller red line with half-circles along it, curves across Labrador and Québec. The circles point east. Joined to the southern end of this is another blue line with triangles. This is curved in the opposite direction, from northern Ontario down to the edge of the image. The triangles point northwest. Across the bottom right corner of the illustration, in the blue area outside Canada’s border, is a curved purple line with both triangles and half circles along it. These point south and east. The area between the red and blue lines, and the purple line is labelled “L.”
Weather Fronts
Weather fronts are the border areas between air of different densities and temperatures.
Cold fronts happen where a mass of colder air is moving towards a mass of warmer air. The colder, denser air quickly pushes the warmer, less dense air up into the atmosphere. The air then cools and condenses. This often causes short-lived showers and thunderstorms.
Warm fronts are where a mass of warmer air is moving towards a mass of colder air. The warm air slowly moves over the cold air and up into the atmosphere. There, it condenses and causes precipitation. Precipitation caused by warm fronts lasts much longer than the precipitation caused by cold fronts.

Image - Text Version
Shown are two colour illustrations of fronts moving over a landscape. The first is titled “Cold Front.” A pale blue arrow pointing from left to right reads “Direction of Front.” Below, three blue arrows point from the left edge toward the centre of the illustration. These are labelled “Cold Air.” Above and to the right of these is a clear, curved blue wall. Above the curve in the wall, several clouds pour rain on the grass below. Three red arrows point from the right side of the illustration, up into the sky, through the clouds in the centre. These are labelled “Warm Air.” In the background, an airplane flies high over a mountain range on the horizon. The second is titled “Warm Front.” A pale blue arrow pointing from left to right reads “Direction of Front.” Below, three red arrows curve up from the ground on the left side of the illustration, into the sky. These are labelled “Warm Air.” Below and to the right, a clear, blue slope curves up the ground, to the sky in the top right corner. Sitting on top of this, a clump of clouds pour rain onto the grass below. Below the slope, three blue arrows point from the middle, along the ground, to the right edge of the illustration. These are labelled “Cold Air.” In the background, an airplane flies high above the clouds, and a mountain range is visible in the distance.
On a weather map, the symbol for a cold front is a blue line with blue triangles. The triangles point in the direction the front is travelling.

Image - Text Version
Shown is a horizontal blue line with blue triangles spaced out along it. The triangles point up from the line, like a row of identical mountains on a horizon.
The symbol for a warm front is a red line with red half-circles. The half-circles point in the direction the front is travelling.

Image - Text Version
Shown is a red horizontal line with red half circles spaced out along it. The circles are above the line, like a row of identical hills on a horizon.
Sometimes you will see a purple line with both triangles and half-circles. This shows the location of an occluded front. An occluded front is where three air masses come in contact with each other. The shapes point in the direction of the colder air.
Learn More
Earth's Atmosphere (2020)
This video (4:35 min.) by Fuse School, illustrates the layers of Earth’s atmosphere, what they do. It also answers the question “Why is the sky blue?”
The Highs and Lows of Air Pressure
This article by the University Corporation for Atmospheric Research explains how temperature and density affect atmospheric pressure.
How to crush a steel drum using air pressure science with Nanogirl and Boris!
This video (3:50 min.) by Nanogirl demonstrates how air pressure can crush a huge steel drum!
What are Weather Fronts? Warm Front, Cold front? (2018)
This video (2:19 min.) by The Weather Network explains how air masses move around the globe and create weather.
This Science Demo is LIT! Air Pressure Demonstration (2019)
In this video (1:53 min.) by the Smithsonian National Air and Space Museum students conduct an experiment to see how a candle changes air pressure.
References
Met Office. (n. d.). High and low pressure.
NASA. (2013). Earth's Atmospheric Layers.
Rutledge, K. et al. (2011). Atmospheric pressure. National Geographic.
Science Struck. (n. d.). Easy Explanation of an Occluded Front With Diagram
University Corporation for Atmospheric Research. (n. d.). The Highs and Lows of Air Pressure.
University Corporation for Atmospheric Research. (n. d.). Weather Fronts.