Sample Size And Reproducibility
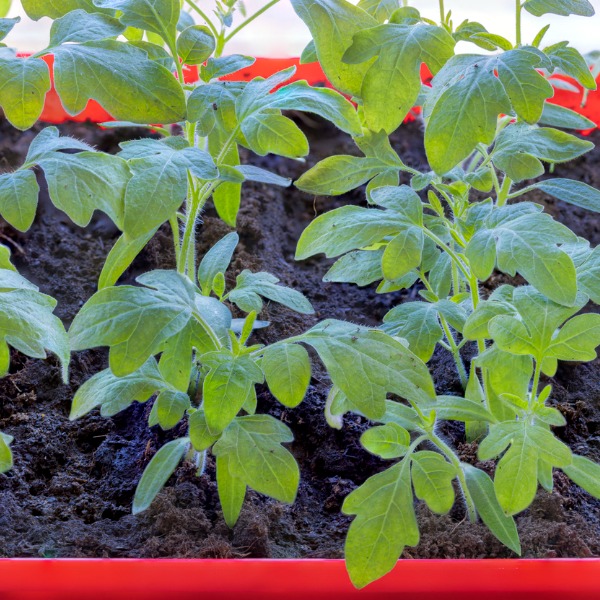
Tray of tomato seedlings (Alexander Shapovalov, iStockphoto)
Tray of tomato seedlings (Alexander Shapovalov, iStockphoto)
How does this align with my curriculum?
Learn how scientists use sample size and reproducibility to develop experiments.
Even a well-planned experimental inquiry can include variability and errors beyond the experimenter’s control. There may be small variations in environmental conditions or the experimenter may not take the most accurate readings. So, how do experimenters know if the results they are observing are affected by one of these errors or by the effects of the independent variable (what the experimenter changed on purpose)?

Image - Text Version
Shown is a colour photograph of four tomato plants in the sun outside a window.
The sun glints off a glass window in a brown frame. Blue sky can be seen reflected in the glass as well.
In the foreground is a row of four plants in cardboard pots. Each plant has multiple branches and pale green leaves, and each one is slightly different in size.
Sample Size
One way that an experimenter can work to minimize the effects of errors and bias, such as natural variation, is by having a greater sample size. The term sample size refers to the number of repeated measurements (e.g., the number of plants grown, etc.). In the example above, the sample size was four. In statistics, the sample size is represented by the letter “n.”
In general, the larger the sample size, the more confident the experimenter can be about the results and findings. With a larger sample size, there is a greater likelihood that random factors will cancel each other and the average result will more accurately represent the phenomena overall, or the population as a whole.
Let’s say that we take an average of the heights of the four plants in the example above.
- Heights: 16 cm, 20 cm, 30 cm, 25 cm
- Average: 22.75 cm
We may ask ourselves, does this average tell us the whole story? If we were to grow other plants, what height would we expect them to be?
Let’s say that we increased our sample size to 10, and all variables being the same, had the following results:
- Heights: 15 cm, 17 cm, 18 cm, 17 cm, 20 cm, 25 cm, 31 cm, 15 cm, 16 cm, 16 cm
- Average: 19 cm
Now we have a much more accurate idea of what height plants would be when given the fertilizer and could conclude with greater certainty. We can also see that most of the plants (6/10) are between 15 cm and 17 cm, and the rest are taller. We could even try to find out why some plants are taller. Were they closer to the window? Did they get more fertilizer? Etc.

Image - Text Version
Shown is a colour photograph of 12 small tomato plants on a wide window sill.
Sun shines through the window and across a rectangular tray of plants. Each plant is in a small section of a reddish brown plastic tray. Three trays have been placed in a clear plastic box on a wide, white windowsill. A small rake and a small spade have been placed next to the box. White curtains are visible in the background.
The plants are tall and thin with large bright green leaves at the tops, and smaller, paler green leaves near the bottoms.
So you may be wondering, what is a good sample size to choose? Too small a sample and you might miss the real effect of the independent variable. Too large a sample and you might waste resources and time.
The size of the sample really depends on the type of experiment and what sort of a difference you are expecting to observe. If you are interested in very tiny differences (e.g., differences in leaf size), you need a very large sample size, but if you only care about big differences (e.g., living or dead after the test), you can use a smaller sample size.
For classroom inquiries, the practical side of sample size also needs to be taken into consideration. In general, it is best to have as large a sample size as you can without jeopardizing the experiment or having the experiment take over the classroom!
Reproducibility and Repeatability
The ways things behave in the natural world are pretty consistent. Nature is not capricious; it doesn’t make errors, systematic or random. Scientists could not make progress if Nature could not be trusted.

Image - Text Version
Shown is a colour photograph of a glass of water with sugar being poured into it from above.
A clear drinking glass has been placed on a grey surface with a background of pale blue, grey, and dark grey streaks. It looks almost like an overcast day. The glass is full of clear liquid. A thick stream of white powder falls into the glass from above, outside the frame.
Reproducing, or repeating, an experiment in the exact same way is also known as replicating it. By doing an experiment more than once, an experimenter is able to check that the method works as expected and gives reliable results. An experiment in which the original experimenter repeats the experiment using the same procedure, the same equipment, the same measuring devices, in the same location and obtains similar results, is said to be repeatable.
But say no one has ever tried your sugar in the water experiment before. Maybe you have made a new discovery! What you need now is for someone else to try your experiment, using the same variables and methods that you used. The ability to duplicate an experiment by another experimenter is known as reproducibility.
Reproducibility is one of the key aspects of scientific processes. If an experiment done by one experimenter gets certain results and other experimenters obtain the same results, then they can be pretty confident that the results are reliable, which is how new knowledge comes about.
On the other hand, sometimes experiments cannot be reproduced. This may be because the experimenter was biased or there were errors in the methods or the observations. This is also useful information and can be one of the ways that scientists discover flaws in each other’s thinking.
For more on bias and errors, check out this backgrounder on Bias and Sources of Error.
Sample Size, Reproducibility and Tomatosphere™
The Tomatosphere™ Seed Investigation has been done by students every year since 2001. Thousands of classes each year repeat the simple experiment first created in partnership with Dr. Michael Dixon from the University of Guelph. On average 15 000 classes a year across Canada and the United States grew tomato seeds and recorded the germination – that’s a big sample size! To see the results of the Seed Investigation submitted by all of the participating classes, make sure you upload your results on the Submit your results page.

Image - Text Version
Shown is a colour photograph of three students observing and recording information about tomato plants.
In the foreground is a round white tray full of small tomato plants in black plastic pots, on a cream coloured table. Three students are gathered around the table, looking intently at the plants.
The student on the left is seated, wearing a grey shirt and a white sweater. They have light brown skin and curly brown hair, pulled back. Their hands are below the table.
The student in the centre is standing and leaning over the table, writing on one of several sheets of paper in their hands. They have long, wavy, dark brown hair and pale skin.
The student on the right is also leaning over the table, and is holding a white ruler with black printing. This student has pale skin and light brown hair in a long braid.
Guided Practice
Exercise 1
What is the average surface area for the following samples of plant leaves?
- Areas: 15 cm2, 17 cm2, 18 cm2
- Areas: 15 cm2, 17 cm2, 18 cm2, 17 cm2, 20 cm2
- Areas: 15 cm2, 17 cm2, 18 cm2, 17 cm2, 20 cm2, 16 cm2, 17 cm2, 18 cm2
- How did the sample size affect the average?
Exercise 2
What is the average number of seeds germinated?
- Number germinated: 15, 20, 25
- Number germinated: 21, 20, 22, 21, 20, 25, 21, 24
- Number germinated: 21, 20, 22, 21, 20, 25, 21, 24, 20, 21, 22, 22
- How did the sample size affect the average?
Exercise 3
Have the students find the mean, median and mode of the height for the following sample of 10 plants.
Heights: 15 cm, 17 cm, 18 cm, 17 cm, 20 cm, 25 cm, 15 cm, 16 cm, 16 cm, 16 cm
Exercise 4
Provide students with the following scenario and have them answer the questions below it.
A student developed an experiment in which she tested different brands of fertilizer on the growth of tomato plants. The student found that plants growing in Fertilizer A grew MUCH taller than the plants growing in the other fertilizer brands. Another student who was interested in the results grew some more of the same tomato plants and kept all of the variables the same, but did not find that the plants growing in Fertilizer A grew much taller than any of the other brands.
- Was the experiment reproducible?
- What might have happened to give the observed results?
- What kinds or errors or biases may have occurred?
Exercise 5
Brainstorm with students in which domains of science reproducibility might be difficult if not impossible.
Answers
Exercise 1
- 16.7
- 17.4
- 17.5
- The larger the sample size, the more accurately the data represents the surface area.
Exercise 2
- 20
- 21.75
- 21.58
- The larger the sample size, the more accurately the data represents the number of seeds that germinated.
Exercise 3
Mean = 17.5, Median = 16.5, Mode = 16
Exercise 4
Possible responses: palaeontology, climatology, meteorology, oceanography, seismology, etc.
Learn More
GCSE Science: AQA Glossary: Repeatable
This page, from AQA Science, provides a concise definition of the word in a scientific context.
Could you describe how to make a P&J sandwich to an alien??
This video (3:49 min.) by Point Source Science demonstrates how important, and how difficult it is to write reproducible directions for an experiment.
Fair tests: a do-it-yourself guide - Understanding Science
This article, from UC Berkeley, explains how to do a fair test, using chocolate chip cookies as an example.
Increasing the Ability of an Experiment to Measure an Effect
This page, from Science Buddies, outlines several ways to improve the signal to noise ratio in experiments.
Science Stories - Uexpected
This video (5:18 min.) explains why we need mathematical help to tell the difference between a real discovery and the illusion of one.
Reproducibility
This article, by Martin Shuttleworth at Explorable.com, provides a detailed explanation of reproducibility and repeatability, and how they can be used in experiments.