How Likely Is It?

Twenty-sided die (Tarah Russell, iStockphoto)

Twenty-sided die (Tarah Russell, iStockphoto)
How does this align with my curriculum?
Learn about probability, a branch of mathematics that helps us predict if something might happen.
Mathematics is the study of numbers, shapes and spaces. It involves measurable quantities and the use of logic to recognize patterns and relationships. These patterns and relationships can help us predict all sorts of events. This includes things such as the weather, sports results, health risk factors, and more.
When we make predictions, we often talk about the chance or likelihood of something happening. Another word for this is probability. Probability can be expressed in fractions, decimals and percentages.
For example, it may be impossible for something to happen. We could say then that it had a probability zero. It may also be absolutely certain for something to happen. We could say that this has a probability of 100%. Between impossible and for certain, the probability will be somewhere between zero and 100%. The lower the probability, the less chance of something happening. The higher the probability, the greater the chance of something happening.
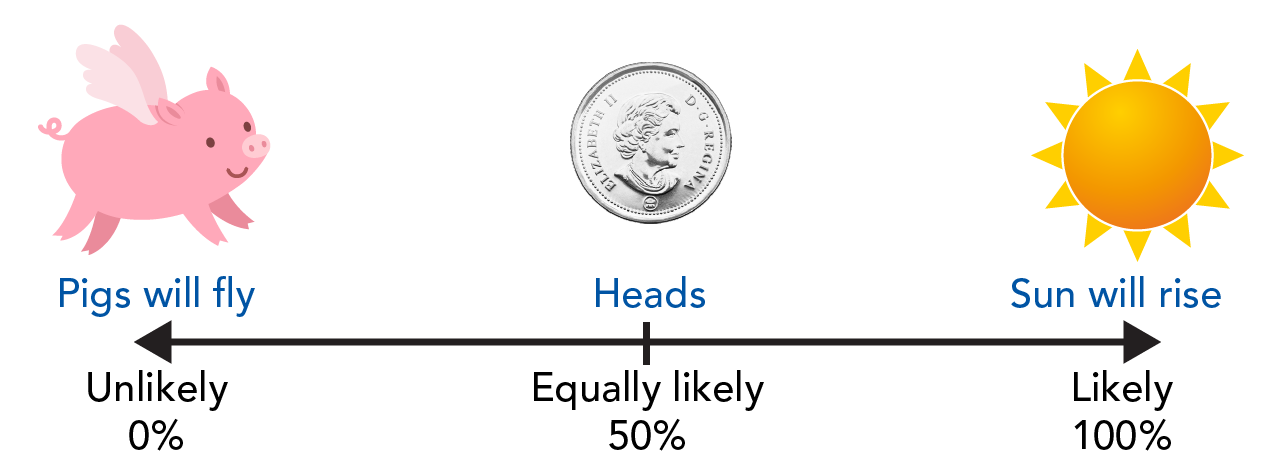
Chance that pigs can fly, coin landing on heads and the sun coming up tomorrow (©2022 Let’s Talk Science).
Image - Text Version
Shown is a colour illustration showing a scale of likelihoods.
On the far left end of the scale is an image of a pink pig with wings. Directly below the image is the text "pigs will fly". In the centre of the scale is an illustration of a coin. Directly below the image is the text "heads". On the far right end of the scale is an image of the Sun. Directly below the image is the text "Sun will rise". Below the text is a black line with arrows at both ends. The line extends from the centre of the pig to the centre of the Sun. Below the arrow at the pig end is the text "Unlikely" and "0%". Below the arrow in the centre is the text "Equally likely" and "50%". Below the arrow at the Sun end is the text "Likely" and "100%"
Coin Toss
Let’s take a look at a classic example of probability in which the events are equally likely. When you toss a two-sided coin, what side would you expect to land facing up? You would probably say that there is an equal chance of it being heads or tails. We can phrase this statement in terms of probabilities and calculate the theoretical outcome for each event.
Theoretical probability =
Number of desired outcomes ÷ the total number of possible outcomes
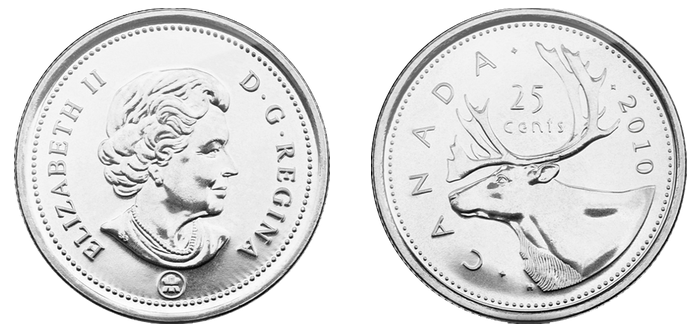
Front and back side of a Canadian quarter coin (Source: Royal Canadian Mint [public domain] via Wikimedia Commons and Royal Canadian Mint [public domain] via Wikimedia Commons).
Image - Text Version
Show is a colour image of the front and back side of a Canadian twenty five cent coin.
On the left is an image of the front of the coin. It has an engraving of Queen Elizabeth the Second and the words "ELIZABETH II" and "D. G. REGINA".
On the right is an image of the back side of the coin. It has an engraving of a caribou head with antlers and the words "CANADA", "25 cents" and "2010"
Question1
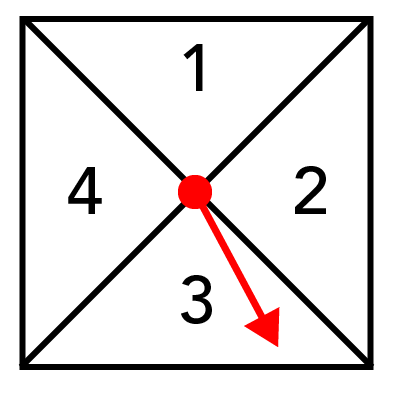
Spinner (©2022 Let’s Talk Science)
Image - Text Version
Shown is a spinner with four parts.
The spinner is a box divided into four parts, labeled clockwise 1 to 4. A red circle is in the middle of the four parts, and an arrow extends from the circle pointing on an angle down through the 3rd section.
Is the chance of getting heads always 50%?
If we were just living in the world of math, the answer would be yes. But we live in the real world. Imagine that you flipped a coin 10 times. How many of those do you think would be heads? You would expect 5, but is that what you would really get?
| Trials: | 1 | 2 | 3 | 4 | 5 | 6 | 7 | 8 | 9 | 10 |
|---|---|---|---|---|---|---|---|---|---|---|
|
Results: H=Heads T=Tails |
H | T | H | H | T | T | T | H | T | T |
In this trial, we got four heads and six tails. From this, we can see that the probability of getting a head is 4/10 or 40% and the probability of getting a tail is 6/10 or 60%.
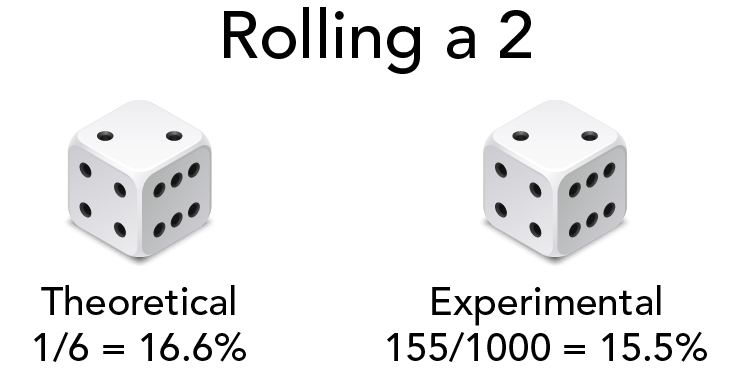
Theoretical versus Experimental probability of getting the number two when rolling a die (©2022 Let’s Talk Science).
Image - Text Version
Shown are a pair of dice, one on each side of the image.
Across the top is the title "Rolling a 2." On the left side is a dice with a 2 showing on top. Beneath this is the word "Theoretical", and beneath this is "1/6 = 16.6%" On the right side is a dice with a 2 showing on top. Beneath this is the word "Experimental", and beneath this is "155/1000 = 15.5%"
We can also write this using the following equation:
Experimental probability =
Number of times event happened ÷ Number of experiments
Question 2
Flip a coin:
- 10 times
- 20 times
- 50 times
What is the probability of getting heads each time?
Talking About the Weather
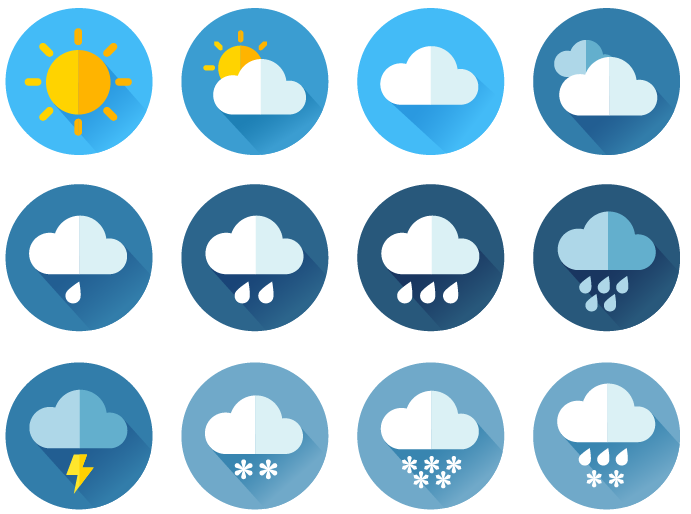
Symbols used to visually represent POP (Let’s Talk Science using an image by AnnaFrajtova via iStockphoto).
Image - Text Version
Shown are 12 circles, each showing a representation of a different type of weather.
The top row shows, from left to right: Full sun, the sun hiding partially behind a cloud, a white cloud on a blue background, and two grey clouds on a darker background.
The middle row shows a white cloud with a single raindrop on a dark grey background. Next to that is a similar symbol with two raindrops, and next to that is one with three raindrops. The last in the row is a dark cloud with five raindrops on a dark background.
The bottom row shows a dark cloud with a yellow lightning bolt coming out of the bottom. The second symbol shows a cloud with two snowflakes, and beside that one with three snowflakes. The last circle shows three raindrops and two snowflakes.
So how do they come up with the percentage? The main way is by looking at historical records in a weather database. The meteorologist can look for days in the past that had a similar temperature, humidity, pressure, etc.
Just like with the coin toss, the more data they have the higher the accuracy of their prediction. From their data, if it has rained 60 out of 100 similar days in the past, they can say the likelihood, known as confidence, is 60. POP also takes into account the geographical area affected by this weather. We call this the coverage. To arrive at a POP the percent confidence is multiplied by the percent coverage and then the decimal is moved two places to the left.
There are different ways to arrive at the same POP. Let’s see how.
- The forecaster is 100% confident that 60% of a given area will see rain or snow, the POP is 60%.
100 x 60 =6 000. Moving the decimal two places gives us 60. - The forecaster is 60% confident that 100% of a given area will see rain or snow, the POP is 60%.
60 x 100 = 6 000. Moving the decimal two places gives us 60. - The forecaster is 80% confident that 75% of a given area will see rain or snow, the POP is 60%.
80 x 75 = 6 000. Moving the decimal two places gives us 60.
Question 3
What is the POP if the forecaster is 80% confident that 30% of a given area will see rain or snow?
Did you know?
A five-day forecast can accurately predict the weather about 90 percent of the time. A seven-day forecast can accurately predict the weather about 80 percent of the time. A 10-day forecast can only accurately predict the weather about 50 percent of the time.
And…you’re up!
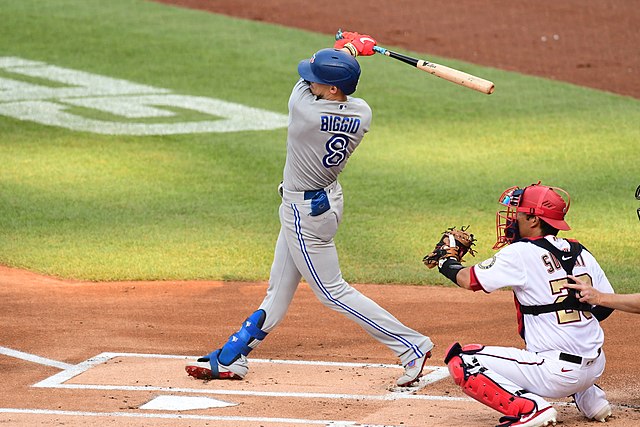
Blue Jays player Cavan Biggio at Nationals Park, July 27, 2020 (Source: All-Pro Reels [CC BY 2.0] via Wikimedia Commons).
Image - Text Version
Shown is a baseball player swinging at a ball while a catcher squats behind him.
The player is Cavan Biggio, wearing a grey and blue Toronto Blue Jays uniform and a blue batting helmet. He is wearing a pair of red batting gloves and holding a baseball bat. The swing is at the end, with the bat pointing backward toward the catcher and the umpire. The catcher behind him is wearing a red helmet and red knee and shin pads. The arm of the umpire can be seen at the bottom right of the image. The bottom of the image is the swept dirt circle around home plate. Above that is a patch of grass with a G on it, and then more swept dirt above that.
The batting average is calculated by dividing the number of hits a batter has divided by the number of turns they have to hit the ball. We call each turn an “at-bat”.
Batting Average = Total number of hits / Total number of at-bats
For example, if a player has 300 at-bats, and has 90 hits, then his Batting Average is 90/300 = 0.300. In baseball, a batting average of 0.300 or higher is considered quite good. It means that the probability of the player getting a hit is 1/3. That is pretty amazing considering how hard pitchers work to make sure players do not get hits!
Question 4
Find the batting average for a professional baseball player.
Probability and Health
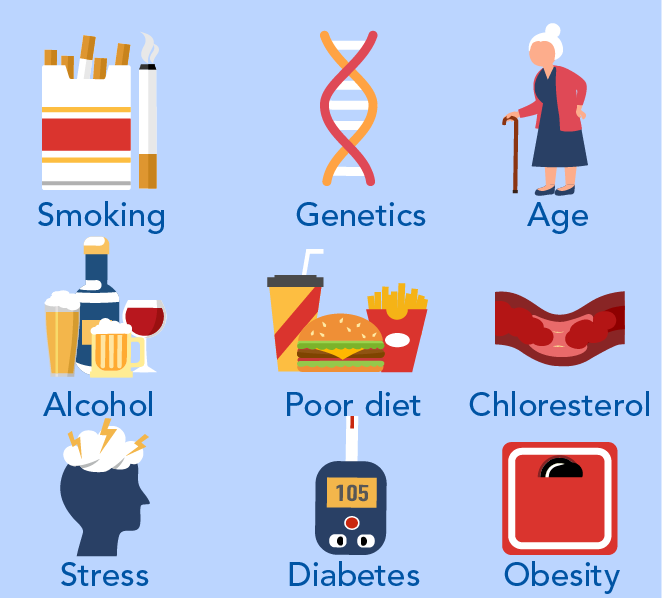
Risk factors for heart disease (Let’s Talk Science using an image by Blueastro via iStockphoto).
Image - Text Version
Shown are a series of 9 illustrations, each representing different factors that can be used to predict health.
The first is smoking, represented by a pack of cigarettes with filters poking out of it, and a smoking cigarette next to the pack. The second symbol is an illustration of a strand of DNA, labelled Genetics. The third symbol is an illustration of an elderly lady with her hand on her hip and her other hand holding a cane. The woman has white hair, a red shawl, and a blue dress. This symbol is labelled Age. The fourth symbol is illustrations of a bottle of liquor, a beer stein, and a wine glass, labelled Alcohol. The fifth symbol is an illustration of a typical fast food meal with a hamburger, French fries, and a fountain soda, labelled Poor Diet. The sixth symbol is an illustration of a clogged artery, labelled Cholesterol. The seventh symbol is an illustration of a blue head, with a white cloud at the top. Yellow lightning bolts are going into the white cloud. This is labelled Stress. The eighth symbol is a blood sugar tester, reading 105, labelled Diabetes. The last symbol is a red bathroom scale, labelled Obesity.
Probability is a very useful branch of mathematics. By letting us calculate or estimate the likelihood of an event, people can better manage risks and make decisions. Probability also makes for some fun and exciting games too!
Answers
Question 1
- 1/4 or 35%
- 2/4 or 50%
- 0/4 or 0%
- 4/4 or 100%
Question 2
Answers will vary but should get closer to 50% with each test.
Question 3
80 x 30 = 2 400. This makes the POP 24%.
Question 4
Answers will vary.
Learn More
Probability Fair Online Game
Play games, win tickets and learn about probability.
Ball Picking Machines
In this game, you pick balls from a machine and identify what the probability is of each colour being chosen.
Probability Definition and Examples
Biology online offers a look at how probability is applied to genetics and whether certain traits are more likely to get passed on to an offspring.
Basic Probability (2019)
This video from MathAntics (11:28 min.) has information about probability with examples.
References
Hamer, A. (2019, Aug. 1) Here’s what a chance of rain really means. Discovery.
Harvard Health Publishing (2013, June 1) 10 myths about heart disease. Harvard Medical school.
Heart & Stroke. (n.d.) Heart disease - risk & prevention.
Math is Fun. (n.d.). Probability.
Mini Webtool (n.d.) Batting average calculator.
NOAA SciJinks (n.d.) Weather forecasting - How reliable are weather forecasts?
Siegmund, D. O. (n.d.). Probability theory. Encyclopaedia Britannica.
Studious Guy (n.d.) 8 real life examples of probability.