Analyzing & Interpreting

Students analyzing and interpreting (Wavebreakmedia, iStockphoto)
Students analyzing and interpreting (Wavebreakmedia, iStockphoto)
How does this align with my curriculum?
Analyzing data is a process of looking for patterns in data that has been collected through inquiry and figuring out about what the patterns might mean. Interpreting the data is a process of trying to explain the patterns that were discovered.
Definition
Analyzing data is a process of looking for patterns in data that has been collected through inquiry and figuring out about what the patterns might mean. Interpreting the data is a process of trying to explain the patterns that were discovered. Analyzing and interpreting data may not always be a simple linear process. Sometimes, more data is needed or the data needs to be recorded and displayed in a different way to discover the patterns.
Analyzing & Interpreting are important because it…
- supports the development of understanding about the relationship between parts and the whole (e.g., graphic displays of data are more than a collection of individual parts but represent a whole picture of some kind of information)
- provides opportunities for students to interpret and synthesize information gained through observations
- supports students’ ability to make inferences, draw conclusions and develop theories
Developing the Skill of Analyzing & Interpreting
Students |
Educators |
|---|---|
|
Organize ideas and sort and display data using pictures, drawings, tables, charts, graphs, etc., read and describe data in graphs, charts, tables, etc. |
Notice and name application of skills acquired in other subject areas (e.g., retelling in language; use of graphs, charts and tables) to display data in mathematics). Prompt students to read the information in graphs, charts, tables, etc., created by other students. |
|
Describe findings, identify patterns in the data and suggest explanations for discrepancies in the data |
Notice and name application of skills acquired in other subject areas (e.g., comprehension strategies such as summarizing in language; reasoning and proving and patterning in mathematics; use of critical thinking skills). Prompt thinking about connections to prior knowledge and/or to learning from other inquiries. |
|
Construct meaning from data on the basis of evidence and in light of the original inquiry question |
Work with students to find patterns in their data (e.g., “When you look at these groups of objects, what characteristics do the objects that float have in common?” “What do you see about the pattern of germination for our seeds?”). |
|
Evaluate the inquiry procedure, explain changes that could be made to improve it, and give reasons for the changes |
Prompt students to make suggestions for improvements to their inquiry methods (e.g., “Did the inquiry go as you thought? Why/why not? What would you do differently next time?”). |
|
Have further wonderings and questions from the patterns, discrepancies, information, and findings from their current inquiry and the inquiries of others |
Notice and name application of skills and attitudes acquired in other subject areas (e.g., questioning skills, attitudes related to curiosity in all areas). Encourage questions and ask “how can we find out?” |
Related Skills
Related Learning Strategies

Chunk-Chew-Check
Teaching STEM
This strategy helps students process and make sense of new information.
Consequence Mapping
Teaching STEM
This strategy helps students to think deeply about the causes and effects of real or imaginary events, issues, or technologies.

Cost-Benefit Analysis
Teaching STEM
This strategy helps students organize information for the purpose of making a decision.

Importance Line
Teaching STEM
This strategy helps students think critically about ideas by ranking them on a scale.

Issues & Stakeholders
Teaching STEM
This strategy helps students develop critical thinking skills by identifying issues and stakeholders
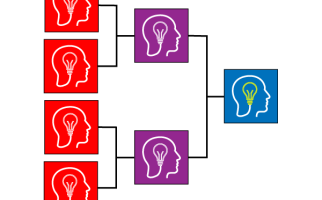
Key Ideas Round Robin
Teaching STEM
This strategy helps students consider the perspectives of others as they summarize key ideas
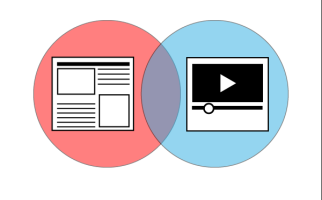
Print-Video Venn Diagram
Teaching STEM
This strategy helps students collaboratively summarize information presented from both a text and a related video.

Pros & Cons Organizer
Teaching STEM
This strategy helps students develop decision-making skills as they determine the pros and cons of an issue.

Video Review
Teaching STEM
This strategy helps students reflect upon and assess a video.