The Solutioneers Week 8: Statistical Analysis

Screen shot from Solutioneers episode 8

Screen shot from Solutioneers episode 8
How does this align with my curriculum?
This week's episodes and hands-on activity explore Statistical Analysis.
BACK TO THE SOLUTIONEERS HOME PAGE
On this episode of The Solutioneers, the girls upload a bunch of data into the AI's software so it can discover trends in their behaviors to help with its predictive verbal commands. After analyzing some of the inputted behaviors, the robot identifies, to their chagrin, that Riley and Kat have the most in common.
And on Future Minds, Aaryan Harshith walks us through his project that takes into account large amounts of data and runs it through an AI statistical analysis to diagnose diabetes early.
Now it's your turn!
Imagine that you have decided to start your own blog. Learn how using Google’s web searches statistics can make sure your blog posts are about popular topics, not just what you think is cool!
Download the activity as a [PDF]
WHAT DO YOU NEED?
- A computer and access to the internet NOTE: If you do not have access to the internet, you can use the picture of the graph and chart here.
WHAT DO YOU DO?
- Go to: https://trends.google.com/trends/. In the top right corner, select Canada as your country.
- Choose a topic for your blog post. Topics could be TV shows, video games, fun craft activities, movies, sports, performers, etc.
- Choose subjects within your topic that you think are currently popular in your province or territory (e.g., for sports it could LeBron James). Filter your results by selecting your province for the last 30 days. If you get an error message, that means there is not enough data. In this case, try to find something more popular.
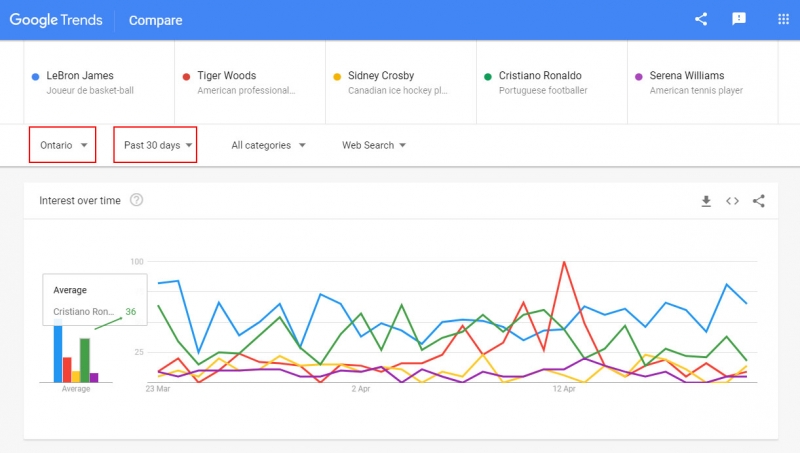
- Next, compare the first search to others on the same topic (e.g., Tiger Woods, Sidney Crosby, etc.). You can do this by clicking “+ compare” at the top right. You can compare up to five things at a time. By hovering your mouse over the bar graph on the left, you can get the number representing the average number of searches.
Google search results for a variety of people who play sports (©2020 Let's Talk Science). - Look for trends. This involves looking to see if the lines are going up or down. It is great to find a topic in which the searches are going up. This means that the subject is getting more popular - which is helpful when writing a blog!
- Look at the graph above. What trends do you see?
| Player | Average interest over time | Trend (up, down, neither) |
|---|---|---|
| LeBron James | 53 | |
| Tiger Woods | 21 | |
| Sidney Crosby | 10 | |
| Cristiano Ronaldo | 36 | |
| Serena Williams | 8 |
WHAT’S THE POINT?
Statistics is the part of math about using data. We collect data to help us make decisions. Collecting and understanding data is a useful skill. Business people use data to understand their customers and offer them the right products. Biologists use data to find solutions like helping endangered species. Name any career and statistics are used in some way!
Google trends is an example of how data can be viewed. Such tools are important to communicate about data to people who are not mathematicians!
Did you know?
Google receives over 63,000 searches per second on any given day!
WHAT ELSE?
Check out these cool careers that involve data and statistics:
- Stacy Dubois (Career Profile)
- Maria Quadir (Career Profile)
Try this:
- Collect your own data by conducting an online poll with friends or a school group (a teacher might be able to help!)
- Improve your results by competing/comparing with a friend. Once both of you have done the previous steps, compare your most popular subject. May the best statistician win!
Partner
With over 114 hours of award-winning kids & family programming, including Kids Emmy Award®-winning series Dark Oracle, and the long-running hit series Life with Derek - alongside family movies featuring some of Canada’s best and brightest stars including Tatiana Maslany, Ellen Page and Sandra Oh, Shaftesbury’s growing slate of kids and family co-viewing programming brings fresh content to a new generation of tween and young adult viewers across all platforms.


