Consequence Mapping

Consequence map (Let's Talk Science)

Consequence map (Let's Talk Science)
Format
How does this align with my curriculum?
PE
9
Science Grade 9 (revised 2018)
Decisions and Perspectives
PE
10
Science 421A (2019)
Decisions and Perspectives
PE
12
Chemistry 621A (draft 2021)
Decisions and Perspectives DP1
PE
11
Chemistry 521A (draft 2021)
Decisions and Perspectives DP1
This strategy helps students to think deeply about the causes and effects of real or imaginary events, issues, or technologies.
Why use it?
- To have students think about the potential consequences, both intended and unintended, of an event, action, issue, problem, trend, or developing technology
- To develop systems thinking and critical thinking skills
- To help students identify and understand cause and effect relationships
Tips for success
- Choose a key question that has positive, neutral, and negative consequences, both intended and unintended, in a number of areas (e.g., economic, environmental, societal, political).
- Ensure students understand the concepts of cause and effect. If necessary, practice determining cause and effect relationships with students.
- Ensure that students understand the difference between primary, secondary, and tertiary consequences.
- Ensure that students understand the difference between a consequence (something that occurs as a direct result of the central question) and a factor (something which is affected by the central question). For instance, “reduced greenhouse gas emissions” would be a consequence, but “greenhouse gases” would be a factor.
- Have a large area to record consequences in a fluid way, so that students do not feel constrained by space.
- Good copies of the templates can be transcribed into a Consequence Mapping Template (see below).
How do I use it?
- Choose one or more pieces of content (articles, videos, timelines, etc.) for students to read or view that present information about an event, trend or decision that can be considered in terms of its future impact and potential consequences.
- Choose a key question to form the core of the consequence map (e.g., “What would be the impact of replacing all gasoline-powered road vehicles in Canada with electric-powered road vehicles?”).
- Choose a time frame for examining the consequences of the key question that will allow students to investigate long-term impacts (for example, 5, 10, 25, 50, or 100 years).
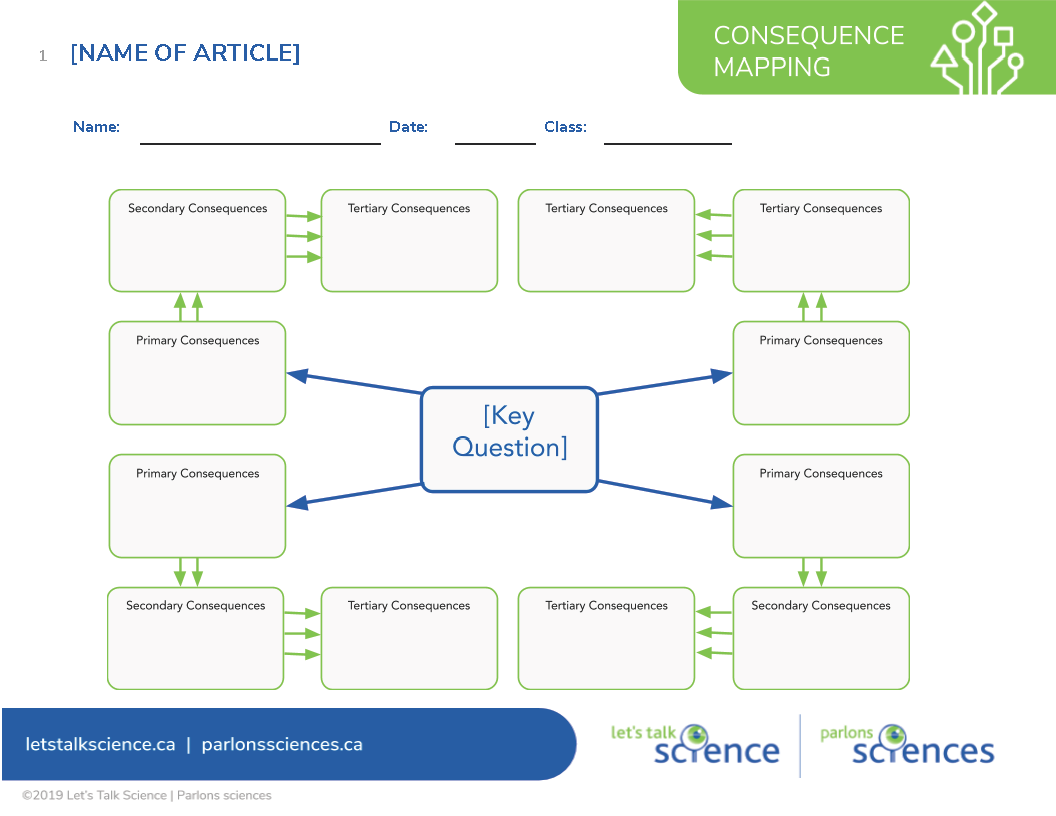
- Write a statement derived from the key question (e.g., “Replacement of gasoline road vehicles with electric road vehicles”) in the centre of a piece of chart paper, on a chalkboard or whiteboard, projected with an LCD projector, etc.
- Brainstorm with the students a number of immediate (or primary) consequences arising from the key question. As the consequences are brainstormed, record those alongside the key question, connected to the key question with a single arrow (see image above). For instance, a primary consequence of the adoption of electric vehicles in Canada would be a vastly increased demand for electricity.
- Choose a single primary consequence and then brainstorm the secondary consequences that arise from that. For instance, the vastly increased demand in electricity in Canada could lead to an increase in the cost of electricity and a demand for construction of new electricity generating plants. These would be secondary consequences of the adoption of electric vehicles in Canada; they were not direct consequences of the adoption of electric vehicles, but rather a result of one of the primary consequences. Record these with a pair of arrows connecting them to the primary consequence that they are a consequence of. Each of those consequences may then have their own consequences (e.g., new electricity generating plants would require enhancements to the electrical grid, and could result in increased greenhouse gas emissions if those plants burn fossil fuels); use three arrows to connect those consequences to the secondary consequence that they are a consequence of. A good consequence map analogy to use is that tipping the first domino (e.g., large-scale adoption of electric vehicles in Canada) produces effects far down a line (or lines) of dominoes.

- Divide class into groups of 3-4 students, assigning each group a primary consequence for which they will brainstorm secondary and tertiary consequences .
- When complete, have each group add its consequences to the main consequence map. Discuss the results.
Variations
- Students could research secondary and tertiary consequences outside of class, either individually or in groups.
- Students could, both individually or in groups, develop their own key question and form a consequence map from that.
- Students could initially think individually about secondary and tertiary consequences, then pair up to share their lists before forming groups for brainstorming.
- Have students present their Consequence Maps in different forms (poster, PowerPoint Presentation, electronic whiteboard, etc.).
Extensions
- Students can categorize the consequences on the map (e.g., environmental, economic, etc.) and indicate whether they consider each consequence to be positive, negative, or neutral in its impact and intended or unintended. This can be done either individually or through class discussion.
- Students could write position papers about the key question, arguing that it is either a net positive or a net negative and justifying their position based on their assessment of all of the consequences (see above).
Using this Strategy
Consequence Map Reproducible Template [Google doc] [.pdf]
- Celiac Disease: When You Really Need to Stay Gluten-Free: Consequence Mapping Reproducible [Google Doc] [PDF]
- COVID-19: Consequence Mapping Reproducible [Google Doc] [PDF]
- Do You Know What's On Your Plate?: Consequence Mapping Reproducible [Google Doc] [PDF]
- Have Scientists Found a Way for People to Live Longer?: Consequence Mapping Reproducible [Google Doc] [PDF]
- How are Arctic Animals in Canada Affected by Climate Change?: Consequence Mapping Reproducible [Google Doc] [PDF]
- How do an Airplane's Tires Help it Land Safely?: Consequence Mapping Reproducible [Google Doc] [PDF]
- How do Introduced Species Affect Ecosystems and the Economy?: Consequence Mapping Reproducible [Google Doc] [PDF]
- Is Vaping Safer than Smoking?: Consequence Mapping Reproducible [Google Doc] [PDF]
- Should Scientists Clone Extinct Species?: Consequence Mapping Reproducible [Google Doc] [PDF]
- Tapping Underground Energy with Heat Pumps: Consequence Mapping Reproducible [Google Doc] [PDF]
- What If You Could Charge Your Phone Using Radio Waves?: Consequence Mapping Reproducible [Google Doc] [PDF]
- What is Fracking?: Consequence Mapping Reproducible [Google Doc] [PDF]
- What is Ocean Warming and Why Does It Matter?: Consequence Mapping Reproducible [Google Doc] [PDF]
- Where Do Hurricanes Come From?: Consequence Mapping Reproducible [Google Doc] [PDF]
- Who Created the Electronic Synthesizer?: Consequence Mapping Reproducible [Google Doc] [PDF]
- Celiac Disease: When You Really Need to Stay Gluten-Free: Completed Consequence Mapping Sample [Google Doc] [PDF]
Create Your Own
Consequence Map Reproducible Template [Google doc] [.pdf]
Ready to Use
- Celiac Disease: When You Really Need to Stay Gluten-Free: Consequence Mapping Reproducible [Google Doc] [PDF]
- COVID-19: Consequence Mapping Reproducible [Google Doc] [PDF]
- Do You Know What's On Your Plate?: Consequence Mapping Reproducible [Google Doc] [PDF]
- Have Scientists Found a Way for People to Live Longer?: Consequence Mapping Reproducible [Google Doc] [PDF]
- How are Arctic Animals in Canada Affected by Climate Change?: Consequence Mapping Reproducible [Google Doc] [PDF]
- How do an Airplane's Tires Help it Land Safely?: Consequence Mapping Reproducible [Google Doc] [PDF]
- How do Introduced Species Affect Ecosystems and the Economy?: Consequence Mapping Reproducible [Google Doc] [PDF]
- Is Vaping Safer than Smoking?: Consequence Mapping Reproducible [Google Doc] [PDF]
- Should Scientists Clone Extinct Species?: Consequence Mapping Reproducible [Google Doc] [PDF]
- Tapping Underground Energy with Heat Pumps: Consequence Mapping Reproducible [Google Doc] [PDF]
- What If You Could Charge Your Phone Using Radio Waves?: Consequence Mapping Reproducible [Google Doc] [PDF]
- What is Fracking?: Consequence Mapping Reproducible [Google Doc] [PDF]
- What is Ocean Warming and Why Does It Matter?: Consequence Mapping Reproducible [Google Doc] [PDF]
- Where Do Hurricanes Come From?: Consequence Mapping Reproducible [Google Doc] [PDF]
- Who Created the Electronic Synthesizer?: Consequence Mapping Reproducible [Google Doc] [PDF]
Completed Consequence Mapping Samples
- Celiac Disease: When You Really Need to Stay Gluten-Free: Completed Consequence Mapping Sample [Google Doc] [PDF]
References
Rannikmäe, M. (2005). Consequence map. Asia-Pacific Forum on Science Learning and Teaching, 6(1), foreword.
Toronto District School Board. (2014). Consequence mapping. EcoSchools Certification Toolkit 2014/15, (pp. 125-130). Toronto District School Board.