Why is the weather so hard to predict?
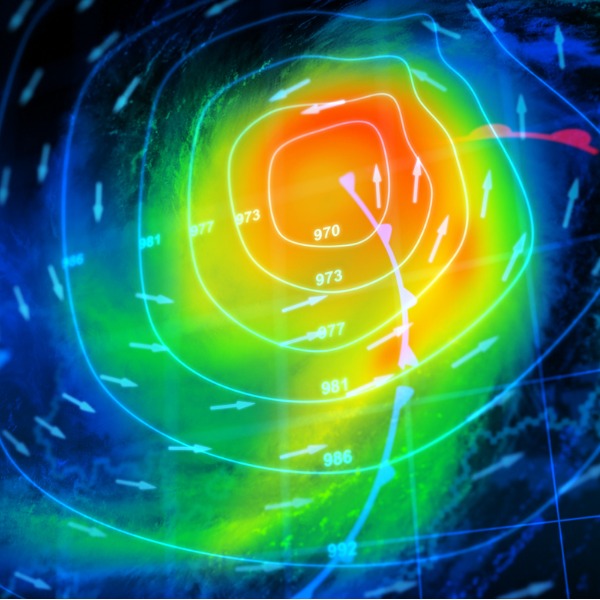
Weather Map (Petrovich9, iStockphoto)
Weather Map (Petrovich9, iStockphoto)
How does this align with my curriculum?
Meteorologists use computer models to predict the weather. Learn why, despite advances in computer science, meteorologists still get it wrong sometimes.
Has this ever happened to you? You check the weather forecast. It predicts rain. And you end up carrying your umbrella around on a beautiful, sunny day.
Back in 2015, the New York Post warned Big Apple residents of Snowmageddon 2015. But what actually happened? A light snowfall.
Meteorologists use computer models to predict the weather. And computational power has come a long way. Yet meteorologists still have trouble correctly predicting the weather over a period of a few days. Sometimes they don’t even get it right over a 24-hour period! Why does this happen? Well, their ability to predict the weather is limited by three factors:
- the amount of available data;
- the time available to analyze it; and
- the complexity of weather events.
Let’s look in detail at the process of predicting the weather.
Where do meteorologists get their information?
Today, weather forecasting or meteorology relies on a huge data collection network. This network includes land-based weather stations, weather balloons, and weather satellites. Weather forecasters also use data from offshore buoys and ships operating at sea. All of these sources combined create an observational network of data. This data is entered into computers to create computer models. Meteorologists use these computer models to make weather forecasts.

Did you know?
The European Center for Medium-Range Weather Forecasts has the best forecast model in the world. This is based on skill scores. Skill scores refer to how accurate the predictions are.
Weather stations are more often located in and around cities. As a result, there is often less data available for rural regions, marine areas, and northern Canada. Also, weather stations far from major airports and cities may not be as accurate as those in more populated areas. That is because rural weather stations are more sparsely placed. They may not be able to provide accurate data for a large area.
Meteorologists often use satellite data to fill in some of these gaps. But there are things that can reduce the accuracy of satellite data. Examples include cloud cover and changes in the amount of water vapour in the atmosphere.

Did you know?
Average annual precipitation can greatly vary even in a small region! Vancouver gets about 1 000 mm of rain annually. But places along the coast of British Columbia may get closer to 2 500 mm!
Numerical weather prediction (NWP) depends on computer weather models and software that analyze observed weather data and make forecasts. When that data is incomplete, the models must interpolate (or estimate) the missing data between the available data points. As the distance between available observational data points grows, the computer model’s ability to interpolate weakens. The chance of an error occurring during interpolation can go up, depending on the time frame getting analyzed. For example, if the forecast period is longer, the model may have to interpolate more data. This can increase the chance of errors in its predictions.
What is a weather model?
Weather models use mathematical equations to analyze and predict atmospheric processes and changes. Weather models use a simplified picture or “grid” of the land surface. This is similar to a road map or a topographic map.
For example, sometimes the resolution of weather models use a grid size of 12 km. This means that each point on the model represents an area of 144 km2 (12 km x 12 km) or larger. If the grid size was smaller, then there would be more data points. For example, imagine a 10 km x 10 km grid for an area of 100 km2. This gives a more accurate model of what will happen.
, 7.5 km (middle) and 80 km (right)")
In some places, the land shape and surface features are fairly constant over a large area. In these places, having a large grid (low resolution) is not such a big issue. But in regions where land features change a lot over short distances, low resolution can cause large errors. Changes in the surface features of an area affect can many factors. For example, they can affect precipitation, temperature, and even winds. Large grids can also make it difficult for meteorologists to accurately predict small-scale weather events. For example, meteorologists have a harder time predicting localized precipitation and thunderstorms with large grids.

I have experienced this meteorological blind spot first-hand. I was once trapped on Burnaby Mountain at Simon Fraser University during a huge snowfall. We had no warning! The snow was highly localized (limited to a particular space). It formed when heavy downpour of rain in the area drew down colder air from above. Because of this, the temperature dropped just below freezing on campus. This happened even though it was too warm for snow at lower altitudes! Buses stopped running. Many students ended up spending the night in the school gym! At this link, you’ll find a video of SFU students experiencing something similar.

How long does it take to analyze a weather model?
Models need to run fairly quickly in order to produce forecasts as fast as people want to receive them. In other words, there is a trade-off between complexity and speed. The more equations and processes included in the model, the longer it will take to create. For example, Environment Canada releases forecasts several times per day. Their meteorologists need enough time to run models and analyze the data before the next forecast is posted.
How much can models really predict?
Weather models are only representations and approximations of reality. They don’t account for all of the variables (factors) that may affect the weather. And researchers are still learning about many of the processes that affect the weather.
Did you know?
Climate change also has an impact on meteorologists’ ability to predict extreme weather events. For example, they may have trouble predicting how long extreme temperature events like the polar vortex experience in central Canada in 2019 will last.
The accuracy of weather forecasts will continue to improve. That’s because computer storage size and speed increase. Weather models will be refined. The observational networks that supply weather data are expanded.
But no matter how complex weather models become or how much observational networks expand, meteorologists will always make forecasting errors. The instruments used to measure weather-related variables will always be imperfect. Earth’s atmosphere is highly complex. It will always be challenging to fully simulate in a weather model. So no matter what the forecast says, it never hurts to carry a raincoat!
Starting Points
- Where do you find out information about the weather? What time of day do you check the weather?
- Do you like to watch weather reports on television? Why or why not?
- Sometimes weather forecasters just “get it wrong”! Have your plans ever been affected by an incorrect weather forecast? How did it make you feel?
- How is weather data used to help protect the public?
- Even if weather predictions can be grossly off, as was Snowmageddon 2015, is there still value in making these predictions? Why? What are the negative impacts of making a wrong prediction?
- Our society is highly dependent on weather forecasting in the transportation sector. Why does weather forecasting have such a huge impact on the transportation sector? Explain.
- Should all meteorologists use the same data set when creating forecasts or is it better to produce as many models as possible for all of the data sets available? Explain.
- What is meteorology?
- Why is the prediction of weather sometimes imprecise? What factors can affect the accuracy of weather predictions?
- What are some of the weather data collecting technologies used by meteorologists?
- What does “interpolating the data” mean when applied to weather forecasting?
- Describe some of the factors that could lead to the variability of weather forecasts for a particular area for the same period of time.
- How has the development of computer systems changed the way weather and climate is predicted?
- Weather forecasting can be defined as the application of science and technology to predict the state of the atmosphere for a given location. Does the variability, and sometimes inaccuracy, of weather forecasts make it more or less of a scientific endeavor? Explain.
- Scientists often have to accept a percentage of error in their research. Usually, this is less than 5%. Is it unrealistic to apply this margin of error in forecast models? Why or why not?
- Weather reporting on television is a very visual experience. Why do you think it is reported like this? What types of images and graphics are provided in a typical weather report? What information can you get from seeing the images that you don’t necessarily hear from the weather reporter?
- Many Hollywood movies have been made based on extreme weather events, such as the 1996 film Twister. Do these representations provide useful insight into how our weather develops or are they merely sensationalized fiction for entertainment? Explain.
- In many areas of Canada, the weather can be big news. Do news agencies sometimes make too much of weather events or is it important that these events be the “Top Story of the Day”? Explain.
- When it comes to weather forecasts, which do you think is most valuable, speed of forecast delivery or accuracy? Is it acceptable to have a trade-off between the two? Explain.
- This article can be used for Earth Science, Computer Science, Math and Technology & Engineering related to the topic of meteorology. Concepts introduced include meteorologists, meteorology, cloud cover, water vapour, Numerical weather prediction (NWP), weather models, interpolate, resolution, low resolution, highly localized, math equations, atmospheric processes, variables and observational networks.
- Before reading this article, teachers could have students watch a weather report at home or as a class. Students could note the different types of information that was provided during a weather report, the geographical area encompassed in the report, and the imagery and graphics that are used in conjunction with the presentation of the report.
- Before reading the article, teachers could also provide students with a Vocabulary Preview learning strategy to help engage their prior knowledge of meteorological terms and to introduce new terminology. Ready-to-use Vocabulary Preview reproducibles are available in [Google doc] and [PDF] formats.
- After reading this article, teachers could have students consolidate their understanding and practice their questioning skills by conducting a Question-Answer Relationship learning strategy. Ready-to-use Question-Answer Relationship reproducibles for this article are available in [Google doc] and [PDF] formats.
- To explore weather forecasting further, teachers could have students compare the requirements given in the Guide to Environment Canada's Public Forecasts with an actual weather forecast from a media source of their choice (i.e., radio station, TV station, specialized weather reporting system, etc.). Students could use a graphic organizer or a Venn diagram to collect and compare their findings.
- To go further, teachers could have students explore the variety of weather data systems that are used globally by visiting the US National Oceanic and Atmospheric Administration (NOAA) Numerical Weather Prediction webpage. Small groups or pairs of students could each investigate one of the systems and then present a synopsis of the key information about that numerical weather prediction system to the rest of the class.
Connecting and Relating
- Where do you find out information about the weather? What time of day do you check the weather?
- Do you like to watch weather reports on television? Why or why not?
- Sometimes weather forecasters just “get it wrong”! Have your plans ever been affected by an incorrect weather forecast? How did it make you feel?
Relating Science and Technology to Society and the Environment
- How is weather data used to help protect the public?
- Even if weather predictions can be grossly off, as was Snowmageddon 2015, is there still value in making these predictions? Why? What are the negative impacts of making a wrong prediction?
- Our society is highly dependent on weather forecasting in the transportation sector. Why does weather forecasting have such a huge impact on the transportation sector? Explain.
- Should all meteorologists use the same data set when creating forecasts or is it better to produce as many models as possible for all of the data sets available? Explain.
Exploring Concepts
- What is meteorology?
- Why is the prediction of weather sometimes imprecise? What factors can affect the accuracy of weather predictions?
- What are some of the weather data collecting technologies used by meteorologists?
- What does “interpolating the data” mean when applied to weather forecasting?
- Describe some of the factors that could lead to the variability of weather forecasts for a particular area for the same period of time.
Nature of Science/Nature of Technology
- How has the development of computer systems changed the way weather and climate is predicted?
- Weather forecasting can be defined as the application of science and technology to predict the state of the atmosphere for a given location. Does the variability, and sometimes inaccuracy, of weather forecasts make it more or less of a scientific endeavor? Explain.
- Scientists often have to accept a percentage of error in their research. Usually, this is less than 5%. Is it unrealistic to apply this margin of error in forecast models? Why or why not?
Media Literacy
- Weather reporting on television is a very visual experience. Why do you think it is reported like this? What types of images and graphics are provided in a typical weather report? What information can you get from seeing the images that you don’t necessarily hear from the weather reporter?
- Many Hollywood movies have been made based on extreme weather events, such as the 1996 film Twister. Do these representations provide useful insight into how our weather develops or are they merely sensationalized fiction for entertainment? Explain.
- In many areas of Canada, the weather can be big news. Do news agencies sometimes make too much of weather events or is it important that these events be the “Top Story of the Day”? Explain.
- When it comes to weather forecasts, which do you think is most valuable, speed of forecast delivery or accuracy? Is it acceptable to have a trade-off between the two? Explain.
Teaching Suggestions
- This article can be used for Earth Science, Computer Science, Math and Technology & Engineering related to the topic of meteorology. Concepts introduced include meteorologists, meteorology, cloud cover, water vapour, Numerical weather prediction (NWP), weather models, interpolate, resolution, low resolution, highly localized, math equations, atmospheric processes, variables and observational networks.
- Before reading this article, teachers could have students watch a weather report at home or as a class. Students could note the different types of information that was provided during a weather report, the geographical area encompassed in the report, and the imagery and graphics that are used in conjunction with the presentation of the report.
- Before reading the article, teachers could also provide students with a Vocabulary Preview learning strategy to help engage their prior knowledge of meteorological terms and to introduce new terminology. Ready-to-use Vocabulary Preview reproducibles are available in [Google doc] and [PDF] formats.
- After reading this article, teachers could have students consolidate their understanding and practice their questioning skills by conducting a Question-Answer Relationship learning strategy. Ready-to-use Question-Answer Relationship reproducibles for this article are available in [Google doc] and [PDF] formats.
- To explore weather forecasting further, teachers could have students compare the requirements given in the Guide to Environment Canada's Public Forecasts with an actual weather forecast from a media source of their choice (i.e., radio station, TV station, specialized weather reporting system, etc.). Students could use a graphic organizer or a Venn diagram to collect and compare their findings.
- To go further, teachers could have students explore the variety of weather data systems that are used globally by visiting the US National Oceanic and Atmospheric Administration (NOAA) Numerical Weather Prediction webpage. Small groups or pairs of students could each investigate one of the systems and then present a synopsis of the key information about that numerical weather prediction system to the rest of the class.
Learn more
11 Extreme Weather Records (2017)
Listicle by Hiufu Wong including information on some of the most extreme global weather events.
Canadian Climate Normals (2019)
Searchable database from Environment Canada of decade-by-decade climate normals for Canadian weather stations.
Guide to Environment Canada's Public Forecasts
Detailed information from Environment Canada on using and interpreting public weather forecasts.
How are weather forecasts made? (2016)
Video (3:06 min.) by EUMETSTAT explaining how the weather is predicted and why it’s important to be able to do so.
The World Meteorological Organization (WMO) coordinates the activities of countries around the world in producing, exchanging and using information about weather, climate and water.
References
Harris, W. (2010, July 7). Why can't scientists accurately predict the weather? How Stuff Works.
Matuschek, O., & Matzarakis, A. (2010). A mapping tool for climatological applications. Meteorological Applications,18(2), 230-237. DOI:10.1002/met.233
National Centers for Environmental Information. (n.d.). Numerical weather prediction.
Nicholson, N. L., Hall, R. D., Morton, W. L., Krueger, R. R., & Bercuson, D. J. (2019, June 11). Climate. Encyclopedia Britannica.
The Weather Window. (n.d.). Calculating the weather.
Warrilow, C. (2012, February 15). Students ask: How do meteorologists predict the weather? Georgia Public Broadcasting.